News Take Action
Changes in Craigslist Rental Data Over Time, 2018-2021
| Date: | March 3, 2022 |
| Share: |
PPG collected Craigslist rental data from February 2018 to November 2021 for the City of Buffalo. Here, we present some key findings about this data and what it might be able to tell us about the state of our rental market.
A note on data collection: PPG collects Craigslist data four times each year. We go through all 2-bedroom listings within City of Buffalo limits on the first Friday of each data collection month (February, May, August, and November).
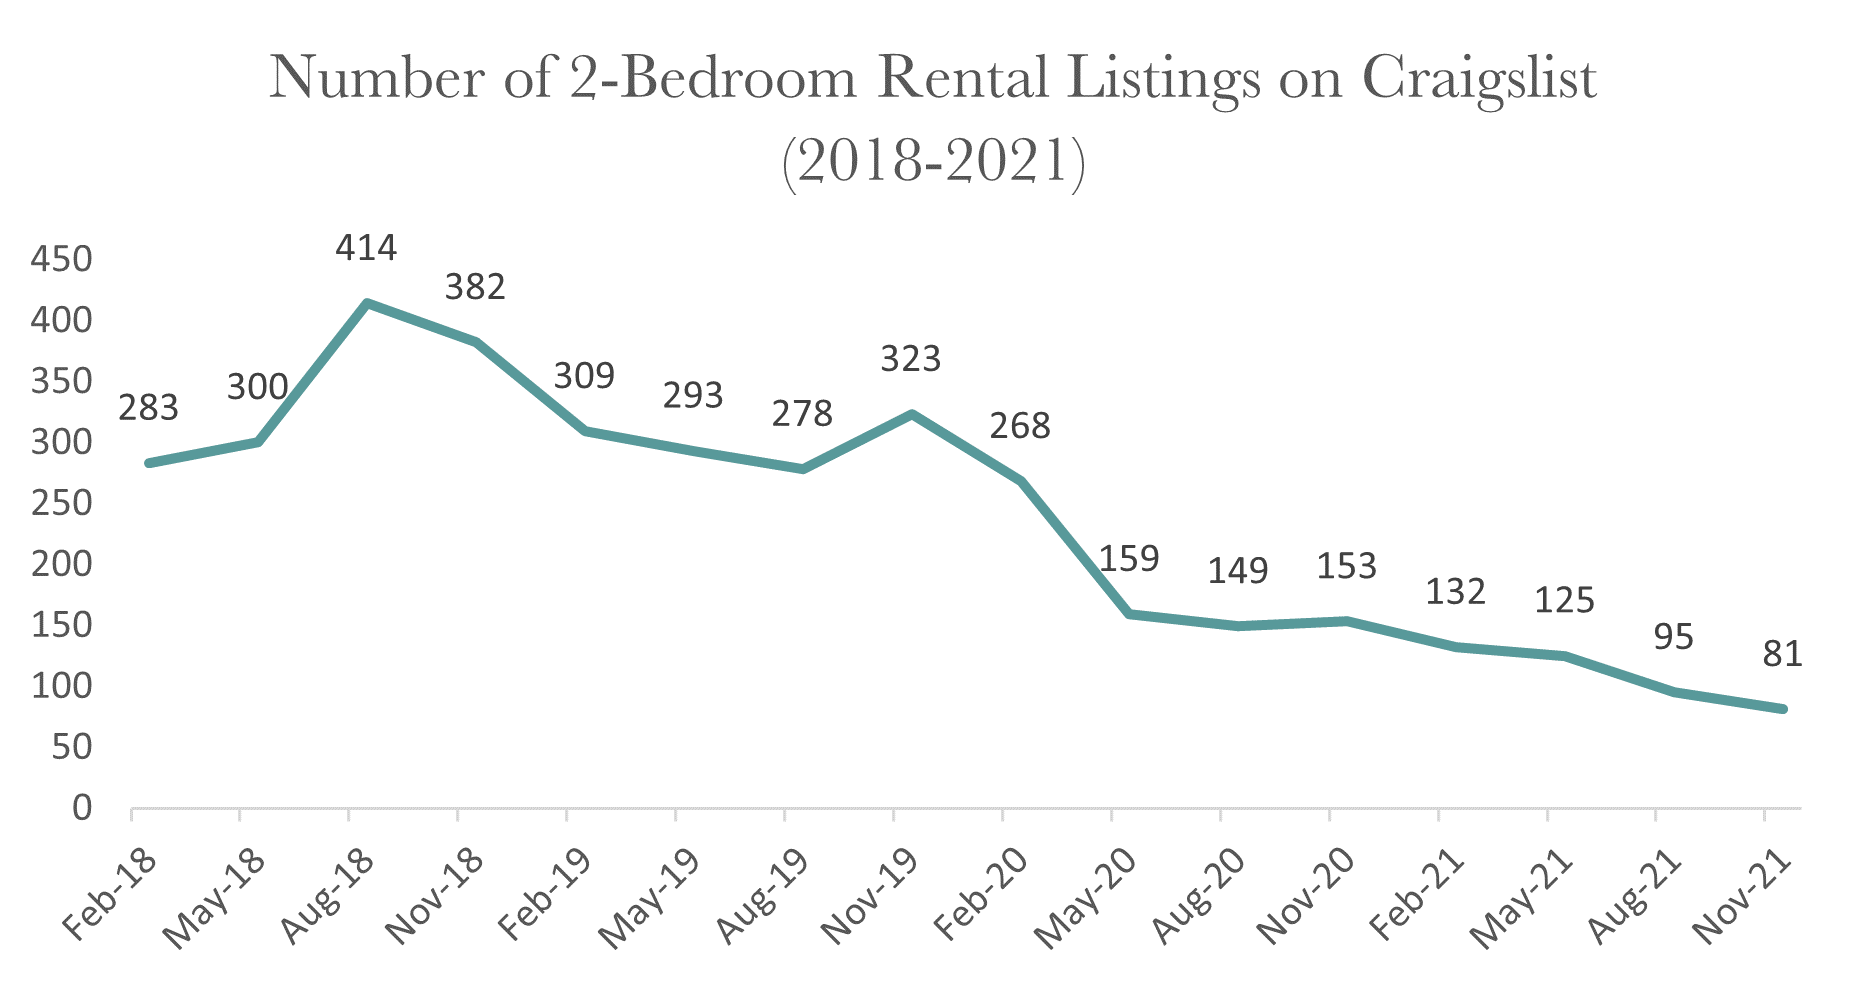
Fewer Apartments Listed
Craigslist rental listings have decreased drastically since 2018, when we began collecting data. On a given data collection day in 2018 or 2019, we would’ve seen anywhere from 200-400 listings for two-bedroom apartments. Around the time that COVID-19 began taking hold in the U.S., we saw markedly fewer listings—159. Since then, the number of listings have continued to drop down to fewer than 100 in our last two collections.
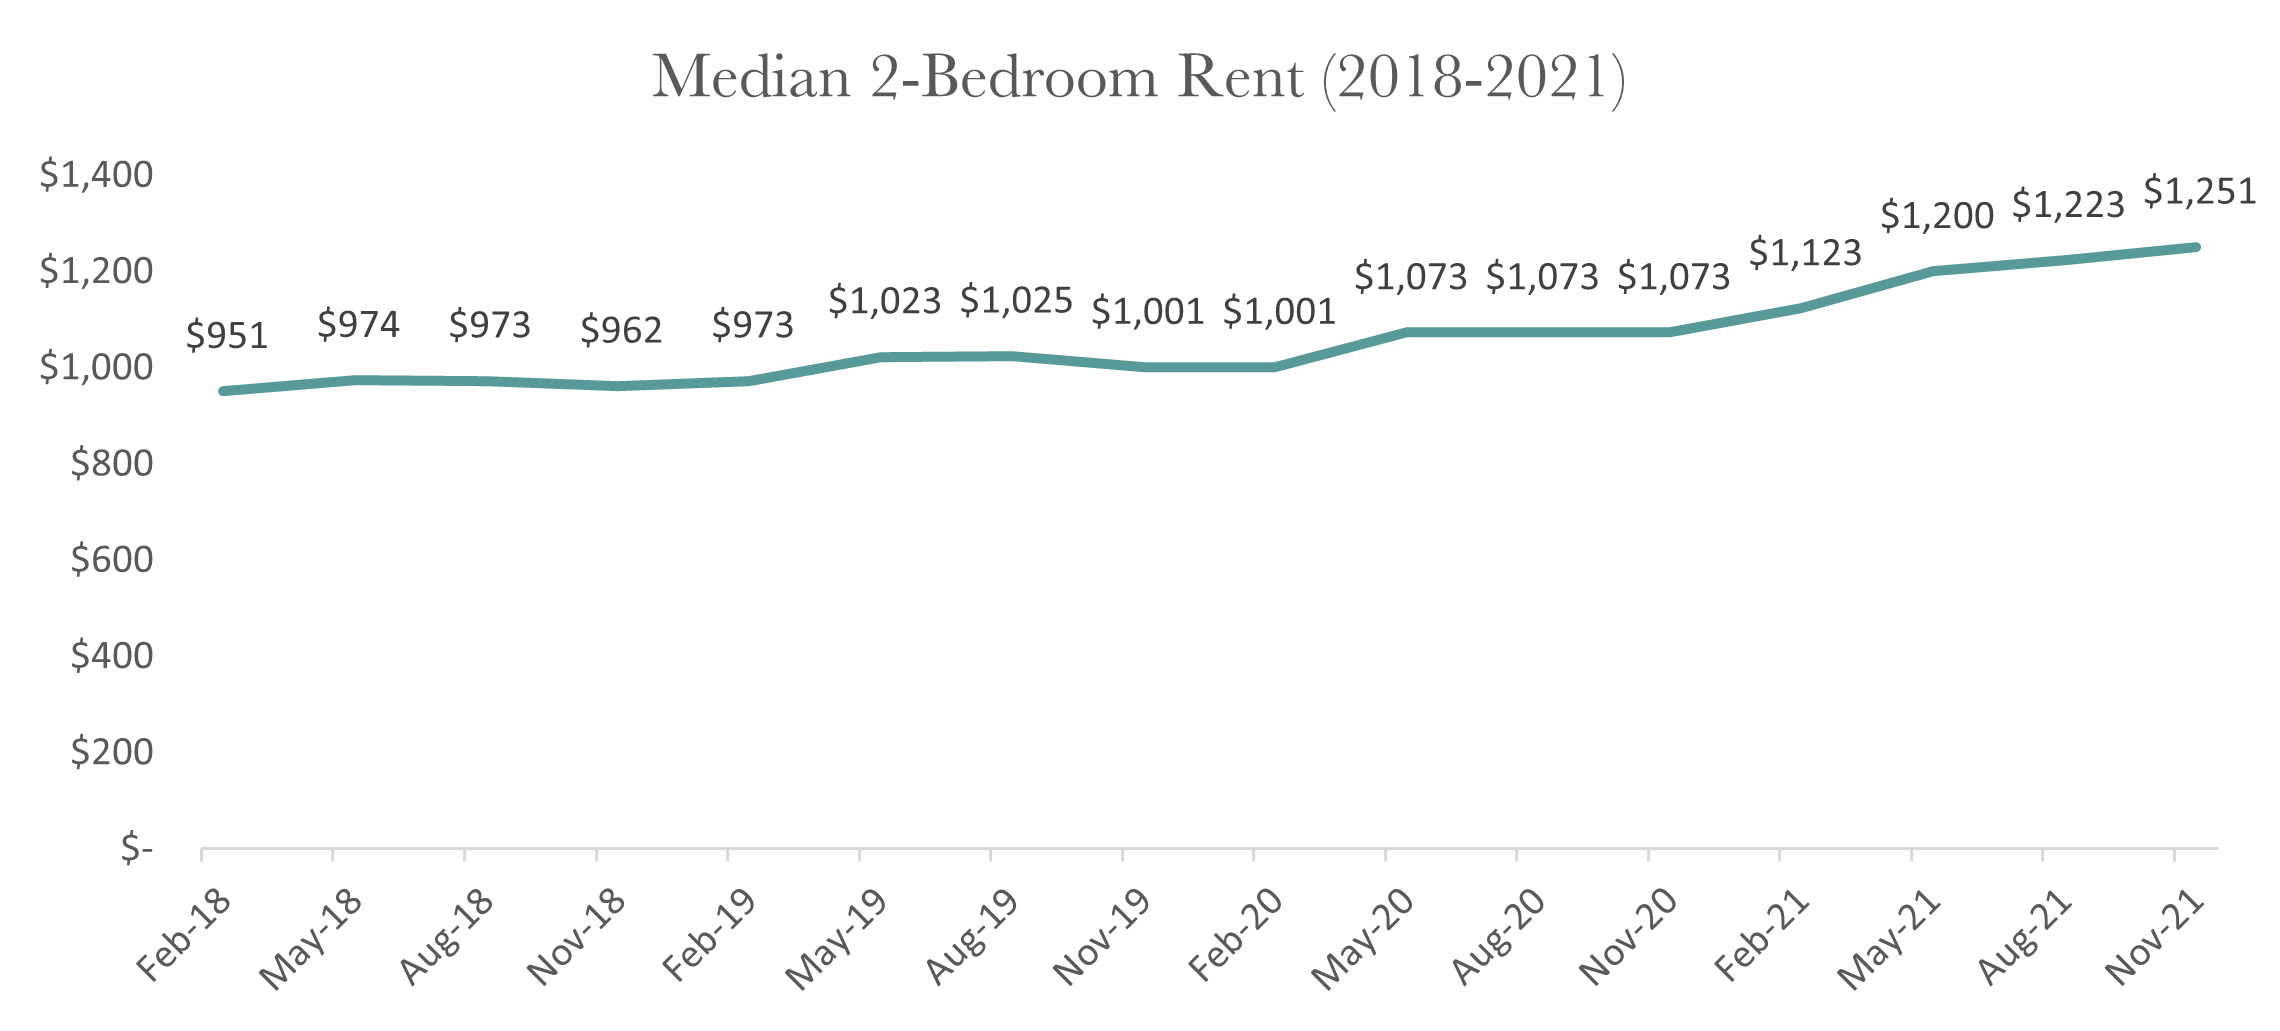
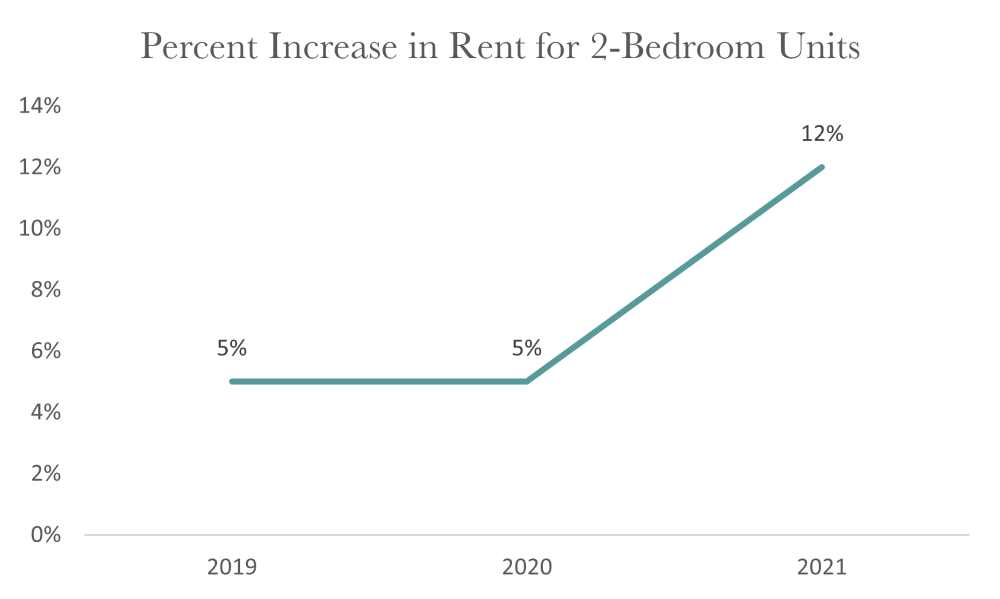
Rental Prices Increasing
We’ve also seen median rental prices in these ads increasing over time. When we collected data in 2018, the median rent listed was $973 (median for all 2018 data). In 2021, the median rent listed was $1,198 — a 23% increase since 2018. We’ve seen an especially large jump in rental price changes between 2020 and 2021. In prior years, there had been about a 5% increase in the median rental prices listed in the ads. However, between 2020 and 2021, there was a 12% increase in median rental costs.
What Does this Mean?
This data is very limited because it only includes one rental ad site. On one hand, the drastic decrease in listings could reflect a trend of fewer landlords and renters using Craigslist to list and find apartment rentals. In recent years, Facebook, for example, has become a popular venue for apartment hunting. Maybe landlords are switching over to that platform and leaving Craigslist behind. However, it’s also possible that this drop in listings is indicative of there actually being fewer apartments for rent in 2021 compared to prior years.
Regarding the rental price data, it could be that mom-and-pop landlords have shifted their marketing strategies to other platforms, while luxury apartment owners continue to list their units on Craigslist, skewing Craigslist rental prices higher over time. However, it’s also possible that these ad price increases are, in part, reflective of actual increasing rental prices over time. If we assume that there are, in fact, fewer apartment listings now than there were in 2018 or 2019, this price increase makes sense. As fewer apartments are available, demand for those units increases, and landlords can raise prices.
When we add other data sources to the mix, it seems likely that our Craigslist data is pointing to substantive rental increases over time. For example, Zillow is another housing listing site that local landlords use. Zillow publishes rental cost data for the Buffalo-Cheektowaga Metro area. Between November 2020 and November 2021, Zillow found a 9.3% increase in rent, from $1,070 to $1,170. The geography in this case is slightly different because it includes both Erie and Niagara counties. However, the trend toward significantly increasing costs is the same. Therefore, while our Craigslist data is limited, when we look at it alongside other comparable sources, we can infer that rental prices in the City of Buffalo are likely rising.
This update was written by Sarah Wooton, Community Researcher at Partnership for the Public Good.