News Take Action
Mapping COVID-19 Cases and Other Local Data
| Date: | May 19, 2020 |
| Share: |
While COVID-19 has impacted our entire region, according to recent testing data, it is hitting some areas harder than others. According to national and local research, COVID-19 has also affected certain populations of people, such as black and African American populations, more severely than others. In this piece, we examine COVID-19 positive case data geographically as it compares to other data including population by race, poverty, housing burden, service worker population, evictions, and water shut offs.
COVID-19 Positive Cases
Over the course of the pandemic, testing access and eligibility in our region has changed frequently. This means that confirmed test cases are not a guaranteed metric for understanding where exactly COVID-19 is most prevalent in our region. However, while positive testing is not a perfect metric, it is still worth examining and understanding. Not everyone who has had COVID-19 will be represented in these positive test results, but we can still get a sense of where COVID-19 might be most heavily impacting our population.
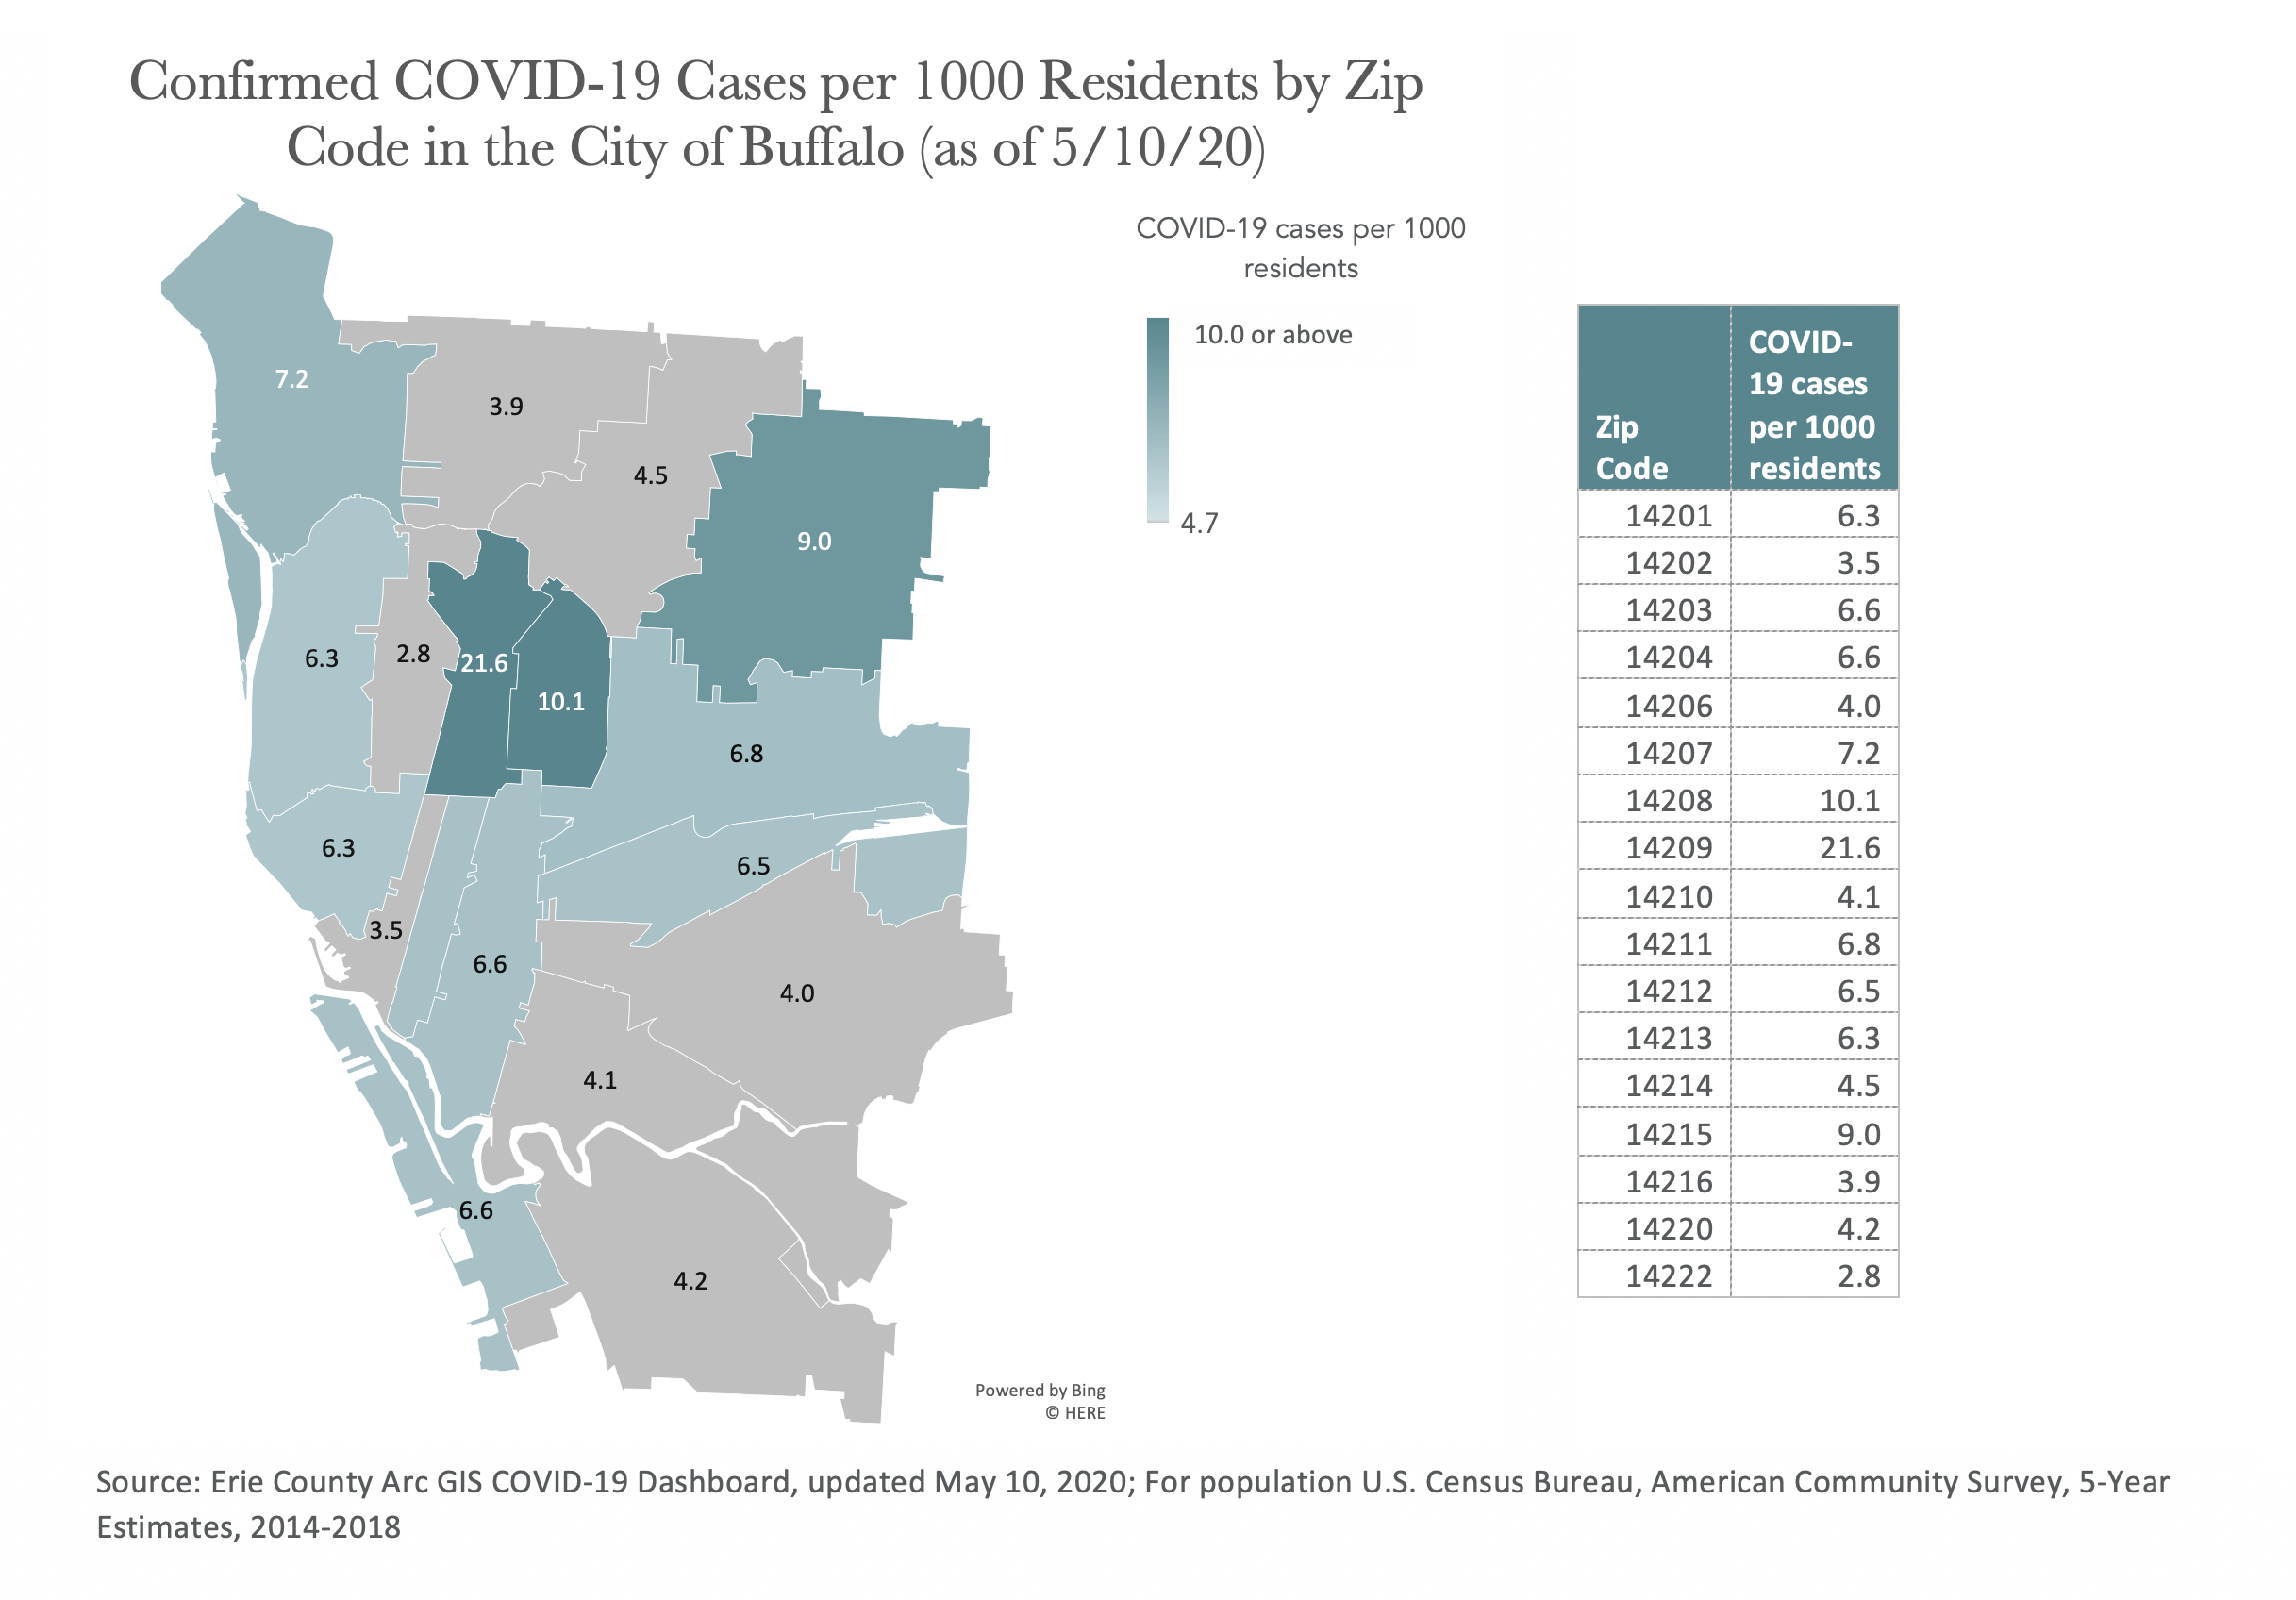
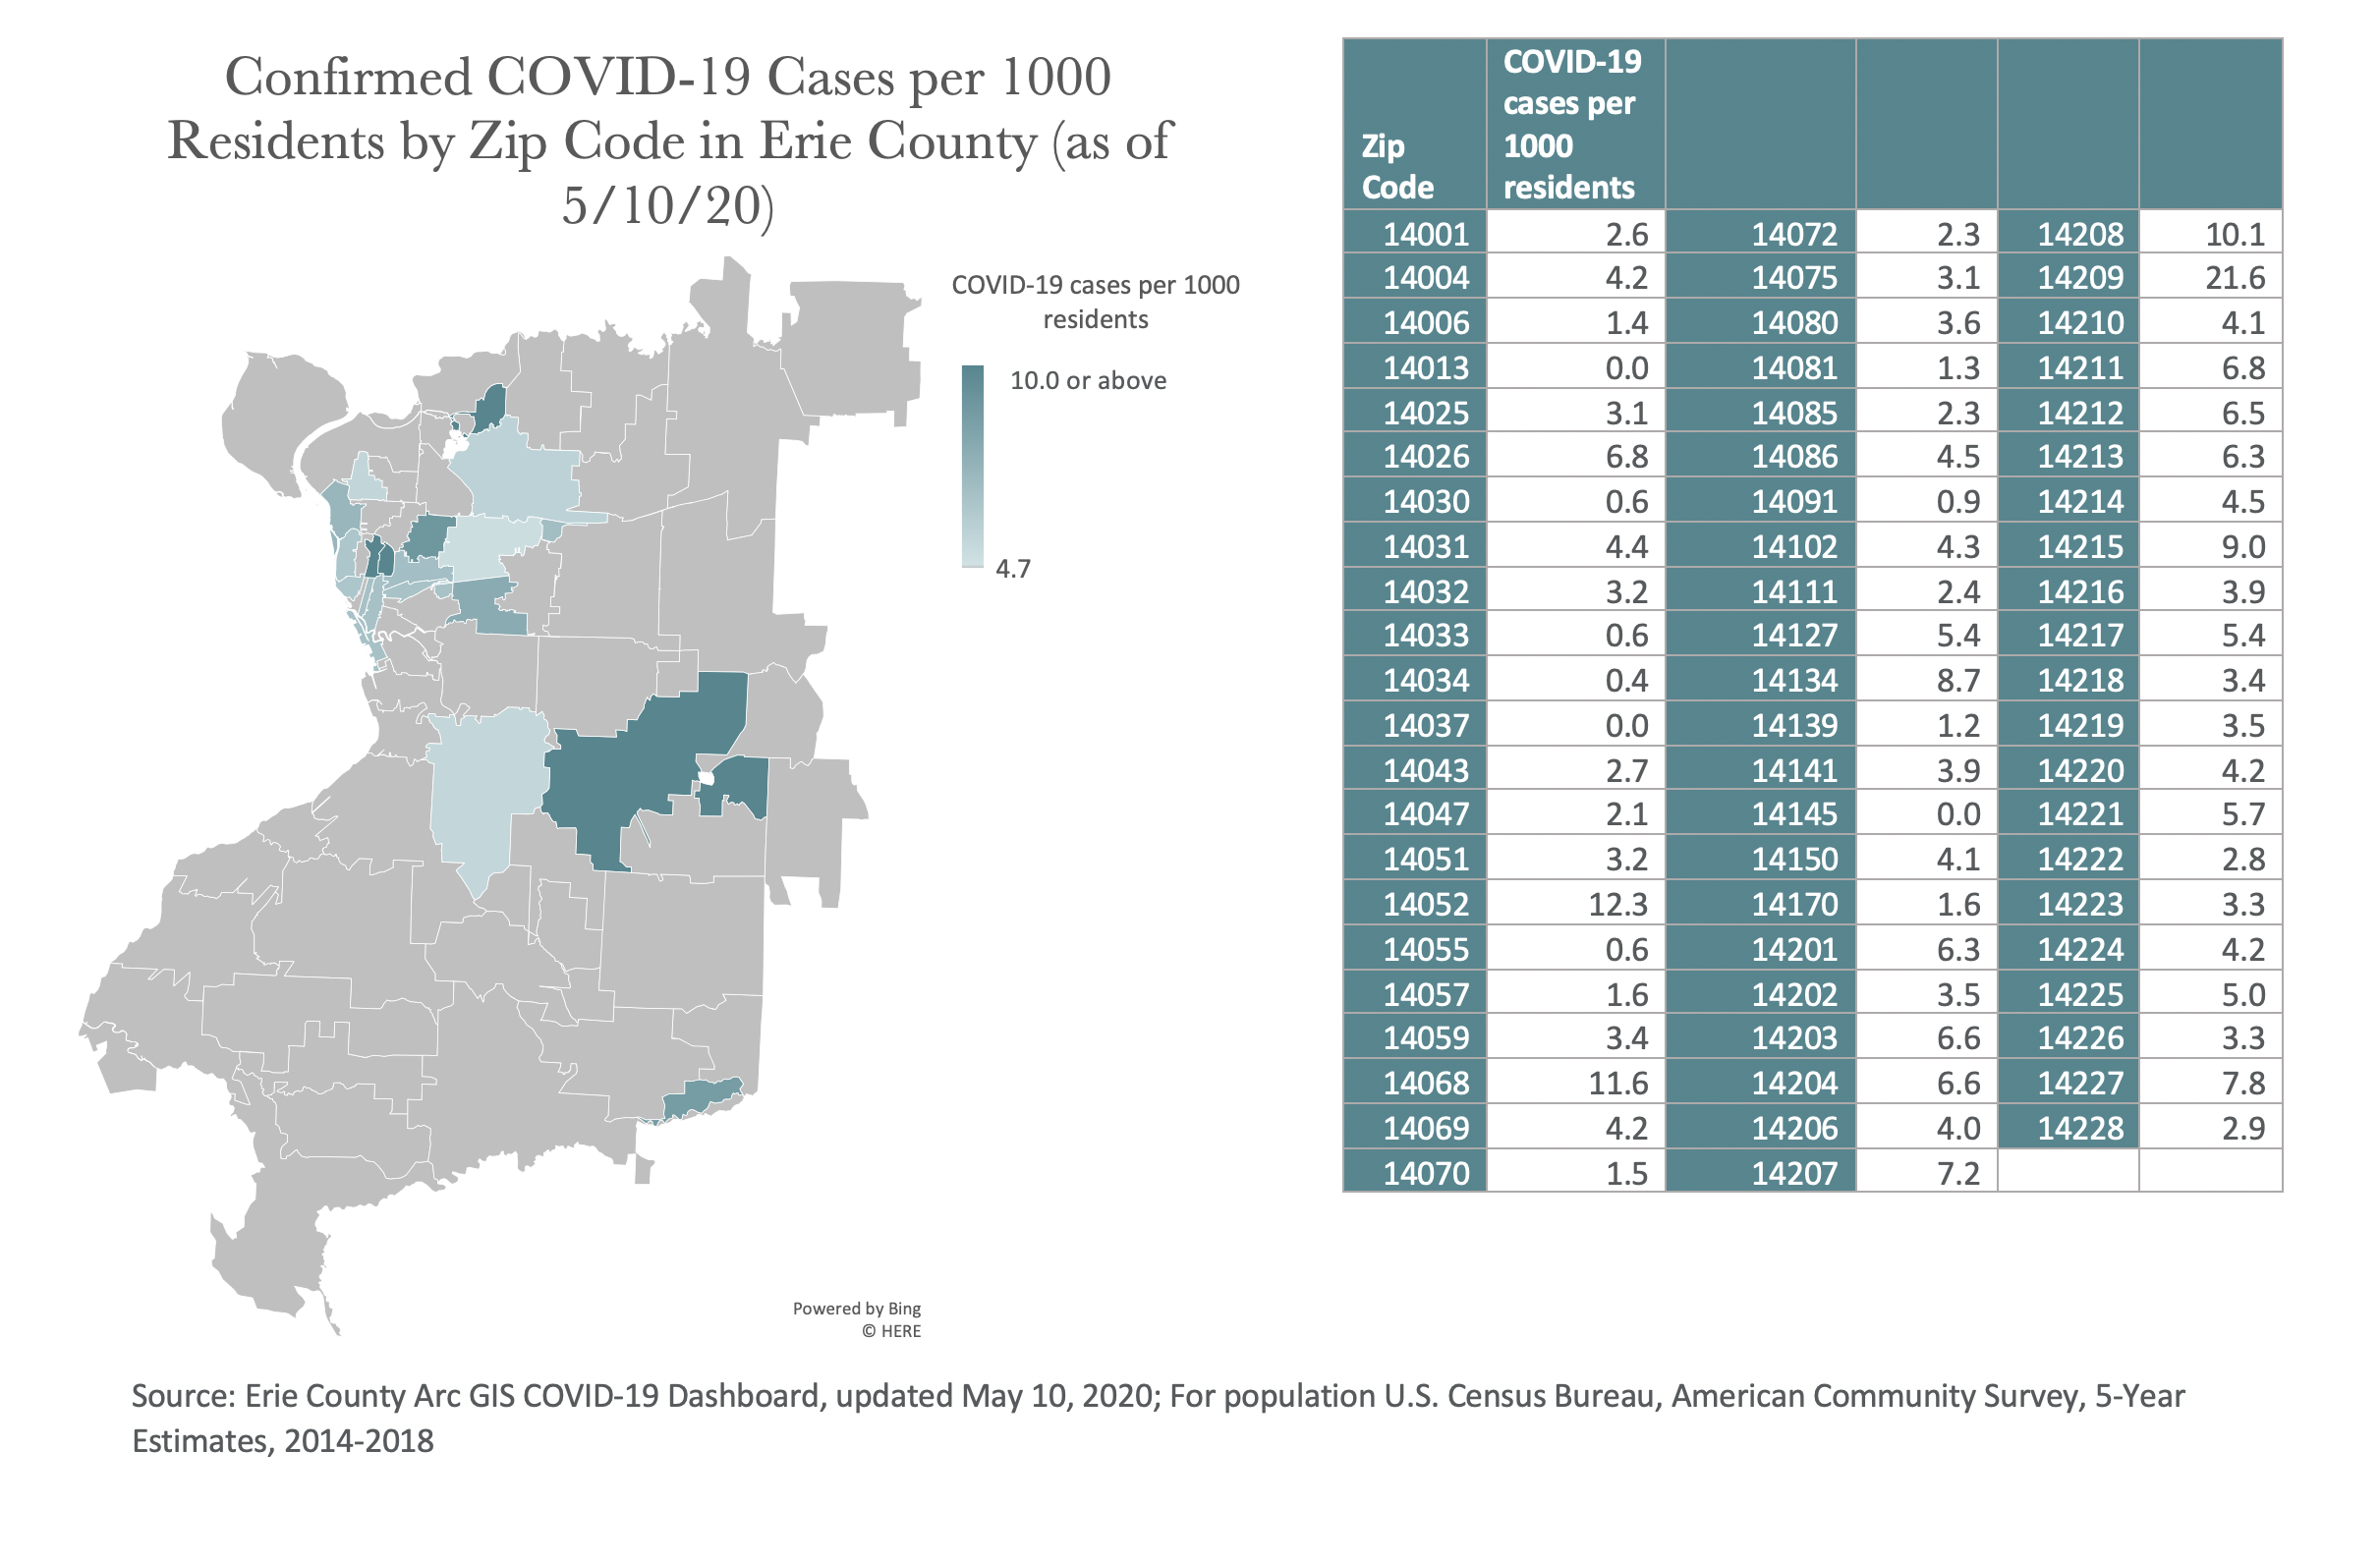
Across Erie County (as of May 10), about 4.8 people per every 1,000 residents had been tested and confirmed as having COVID-19. In these maps, zip codes are marked gray if their COVID-19 positive rate is lower than the county-wide average. The darker teal a zip code is, the higher its rate of COVID-19 positive cases. Of the top ten zip codes with the highest COVID-19 positive rate, five are located within the City of Buffalo (14209, 14208, 14215, 14207, 14211) and five are located elsewhere in Erie County (14052, 14068, 14134, 14227, 14026). That said, most zip codes in the city have a higher COVID-19 rate than the county-wide average, whereas only 19% of zip codes outside of the city do. Zip code 14209 (which encompasses Masten Park, Linwood Avenue, and parts of the Elmwood Village)—has the highest COVID-19 rate far and away at 21.6 cases per thousand residents, more than quadruple the county-wide average.
Race
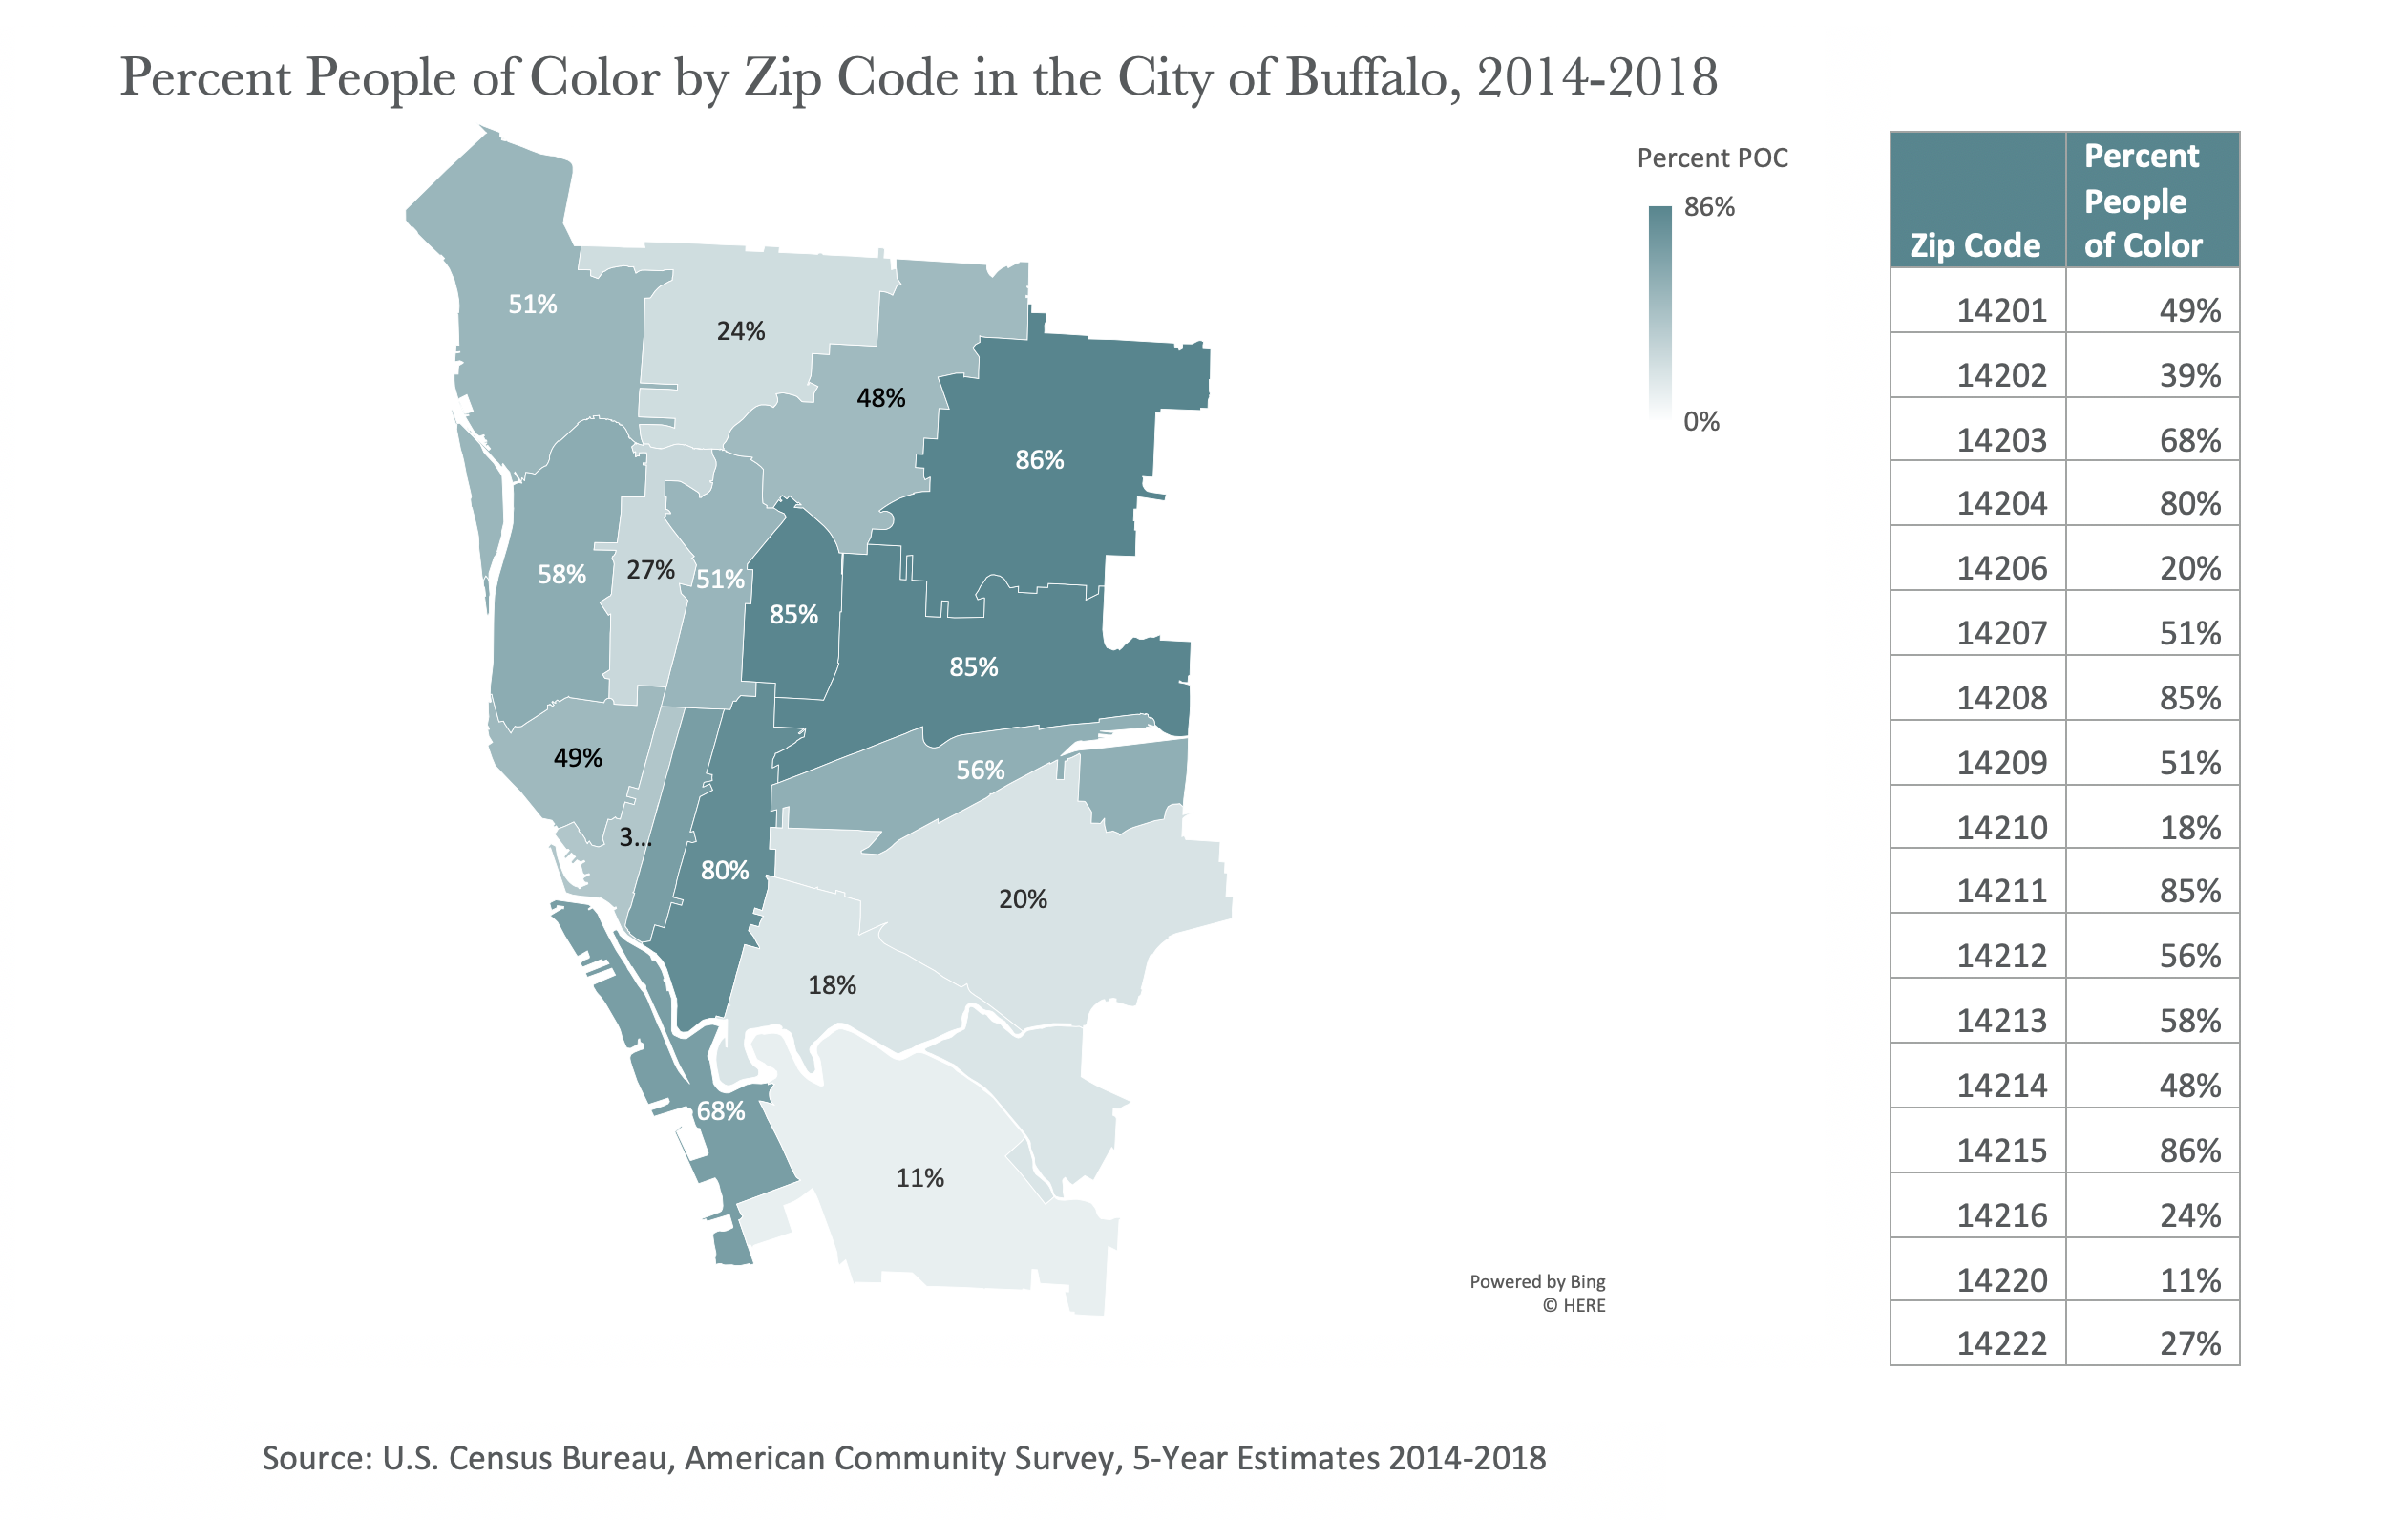
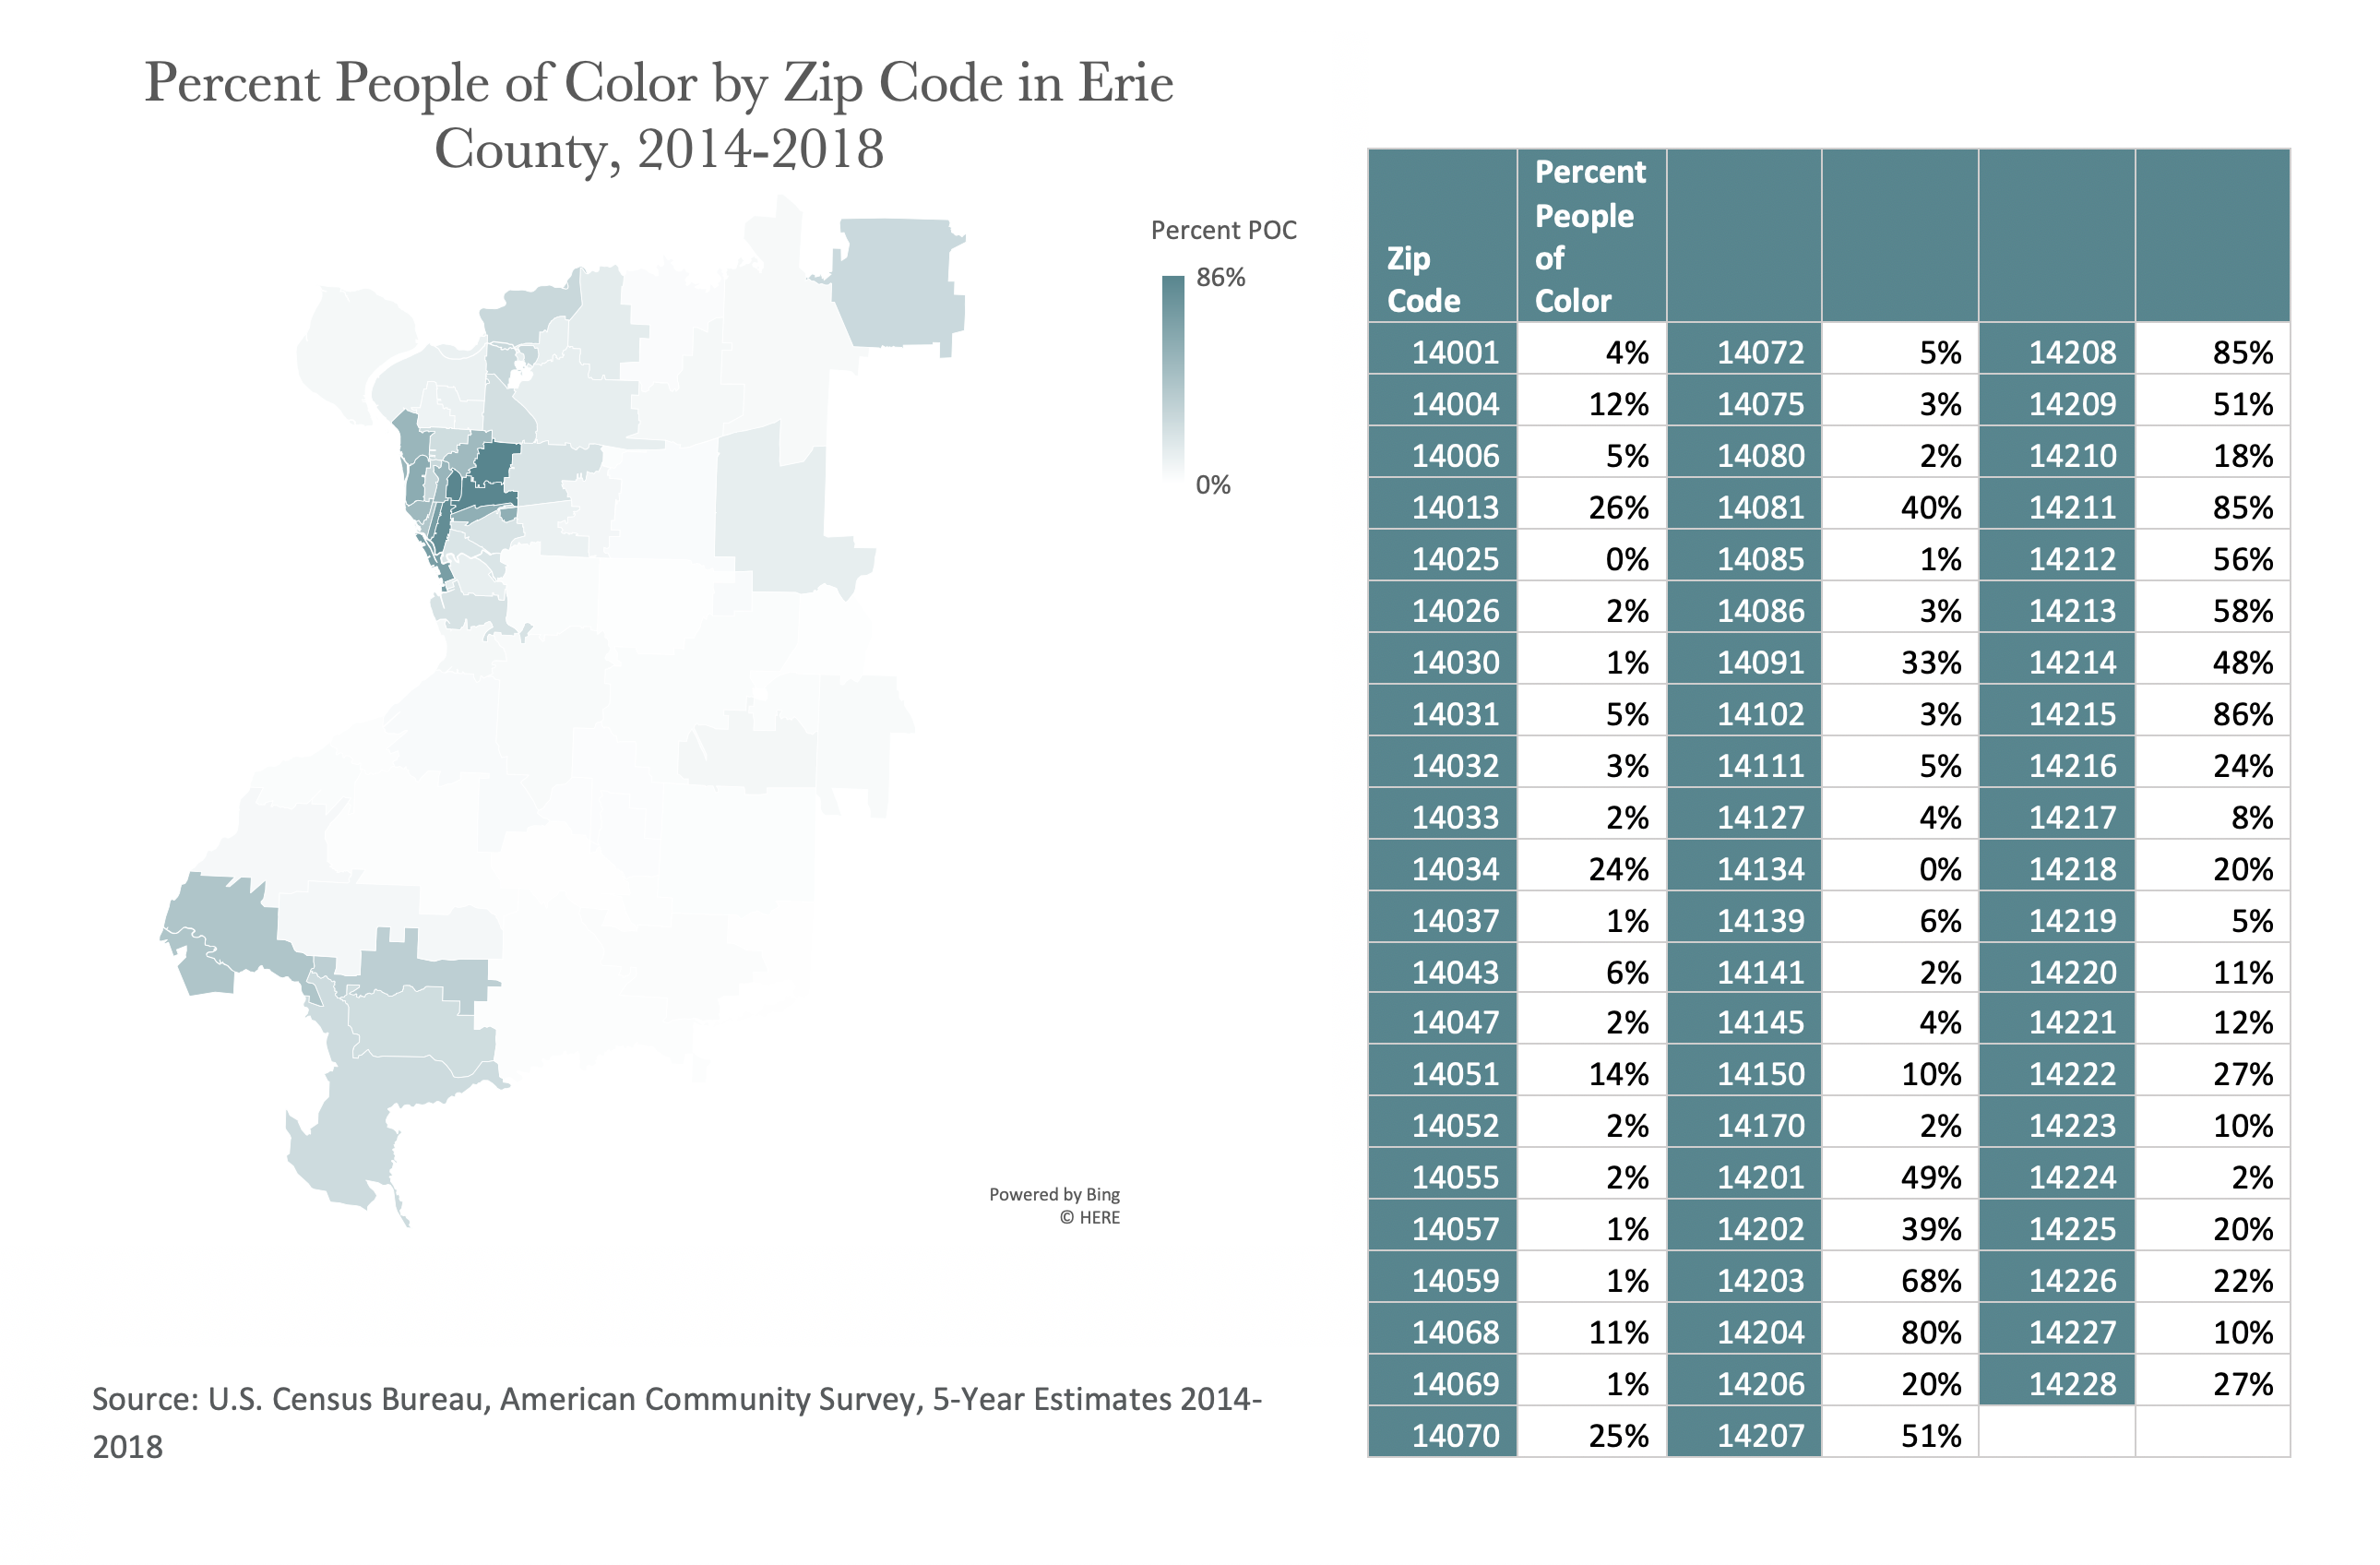
Within Buffalo, the zip codes with the highest rates of COVID-19 have populations that are majority people of color (POC). Interestingly, nearly all zip codes within the City with majority POC populations also have the highest COVID-19 rates of the City. That is, 8 of the 9 zips with majority POC populations have higher COVID-19 rates than the remaining 8 zip codes that are majority white. Outside of the City, zip codes with the highest COVID-19 rates don’t correlate to higher populations of people of color.
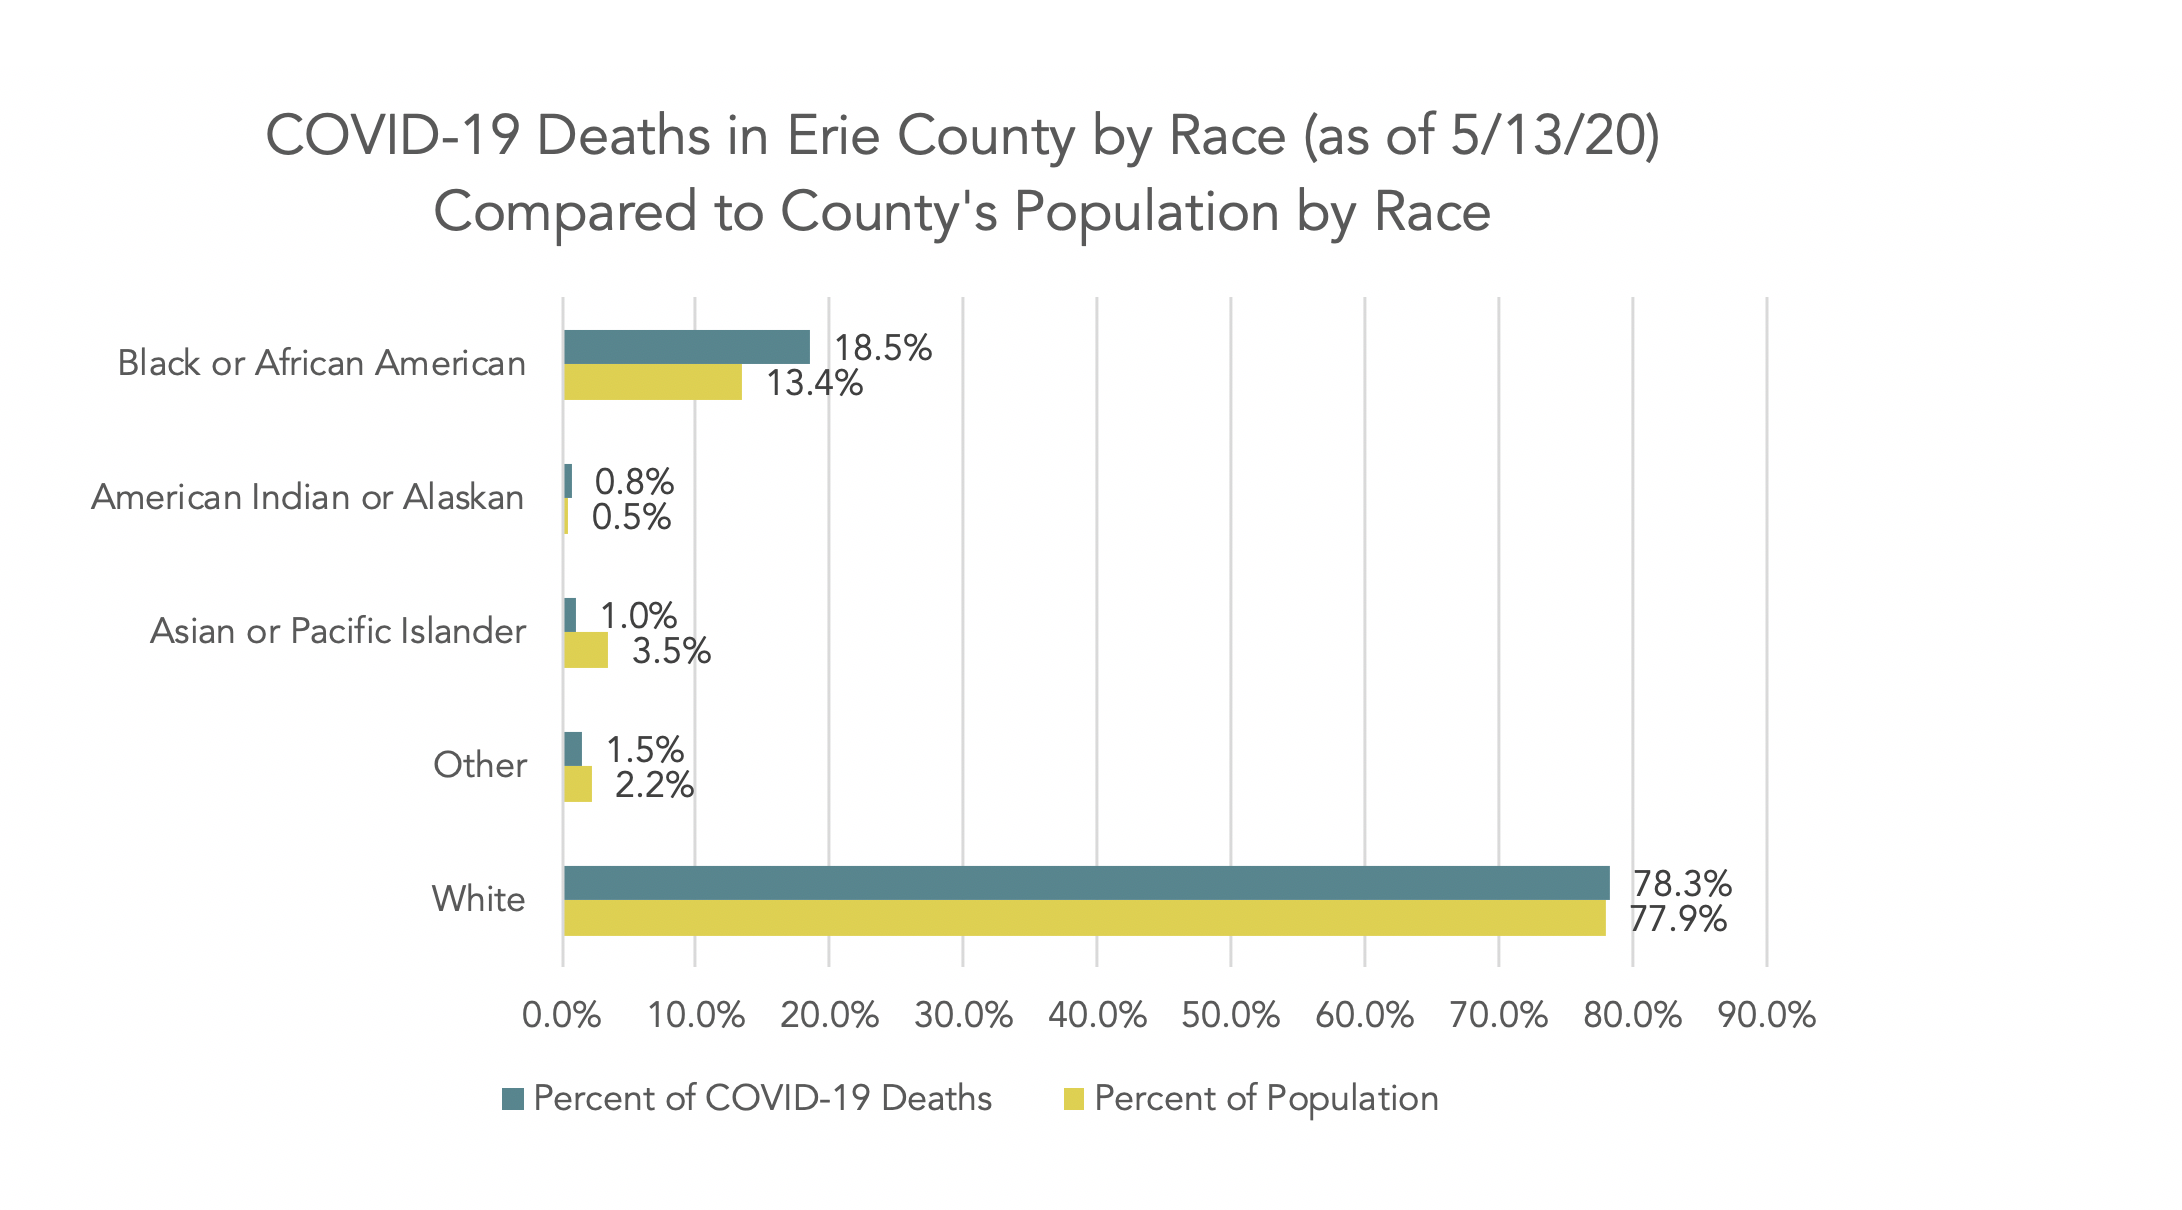
When looking at COVID-19 related deaths across the county, we see that deaths are slightly higher for Black or African American residents than is represented in the county by population.
Poverty
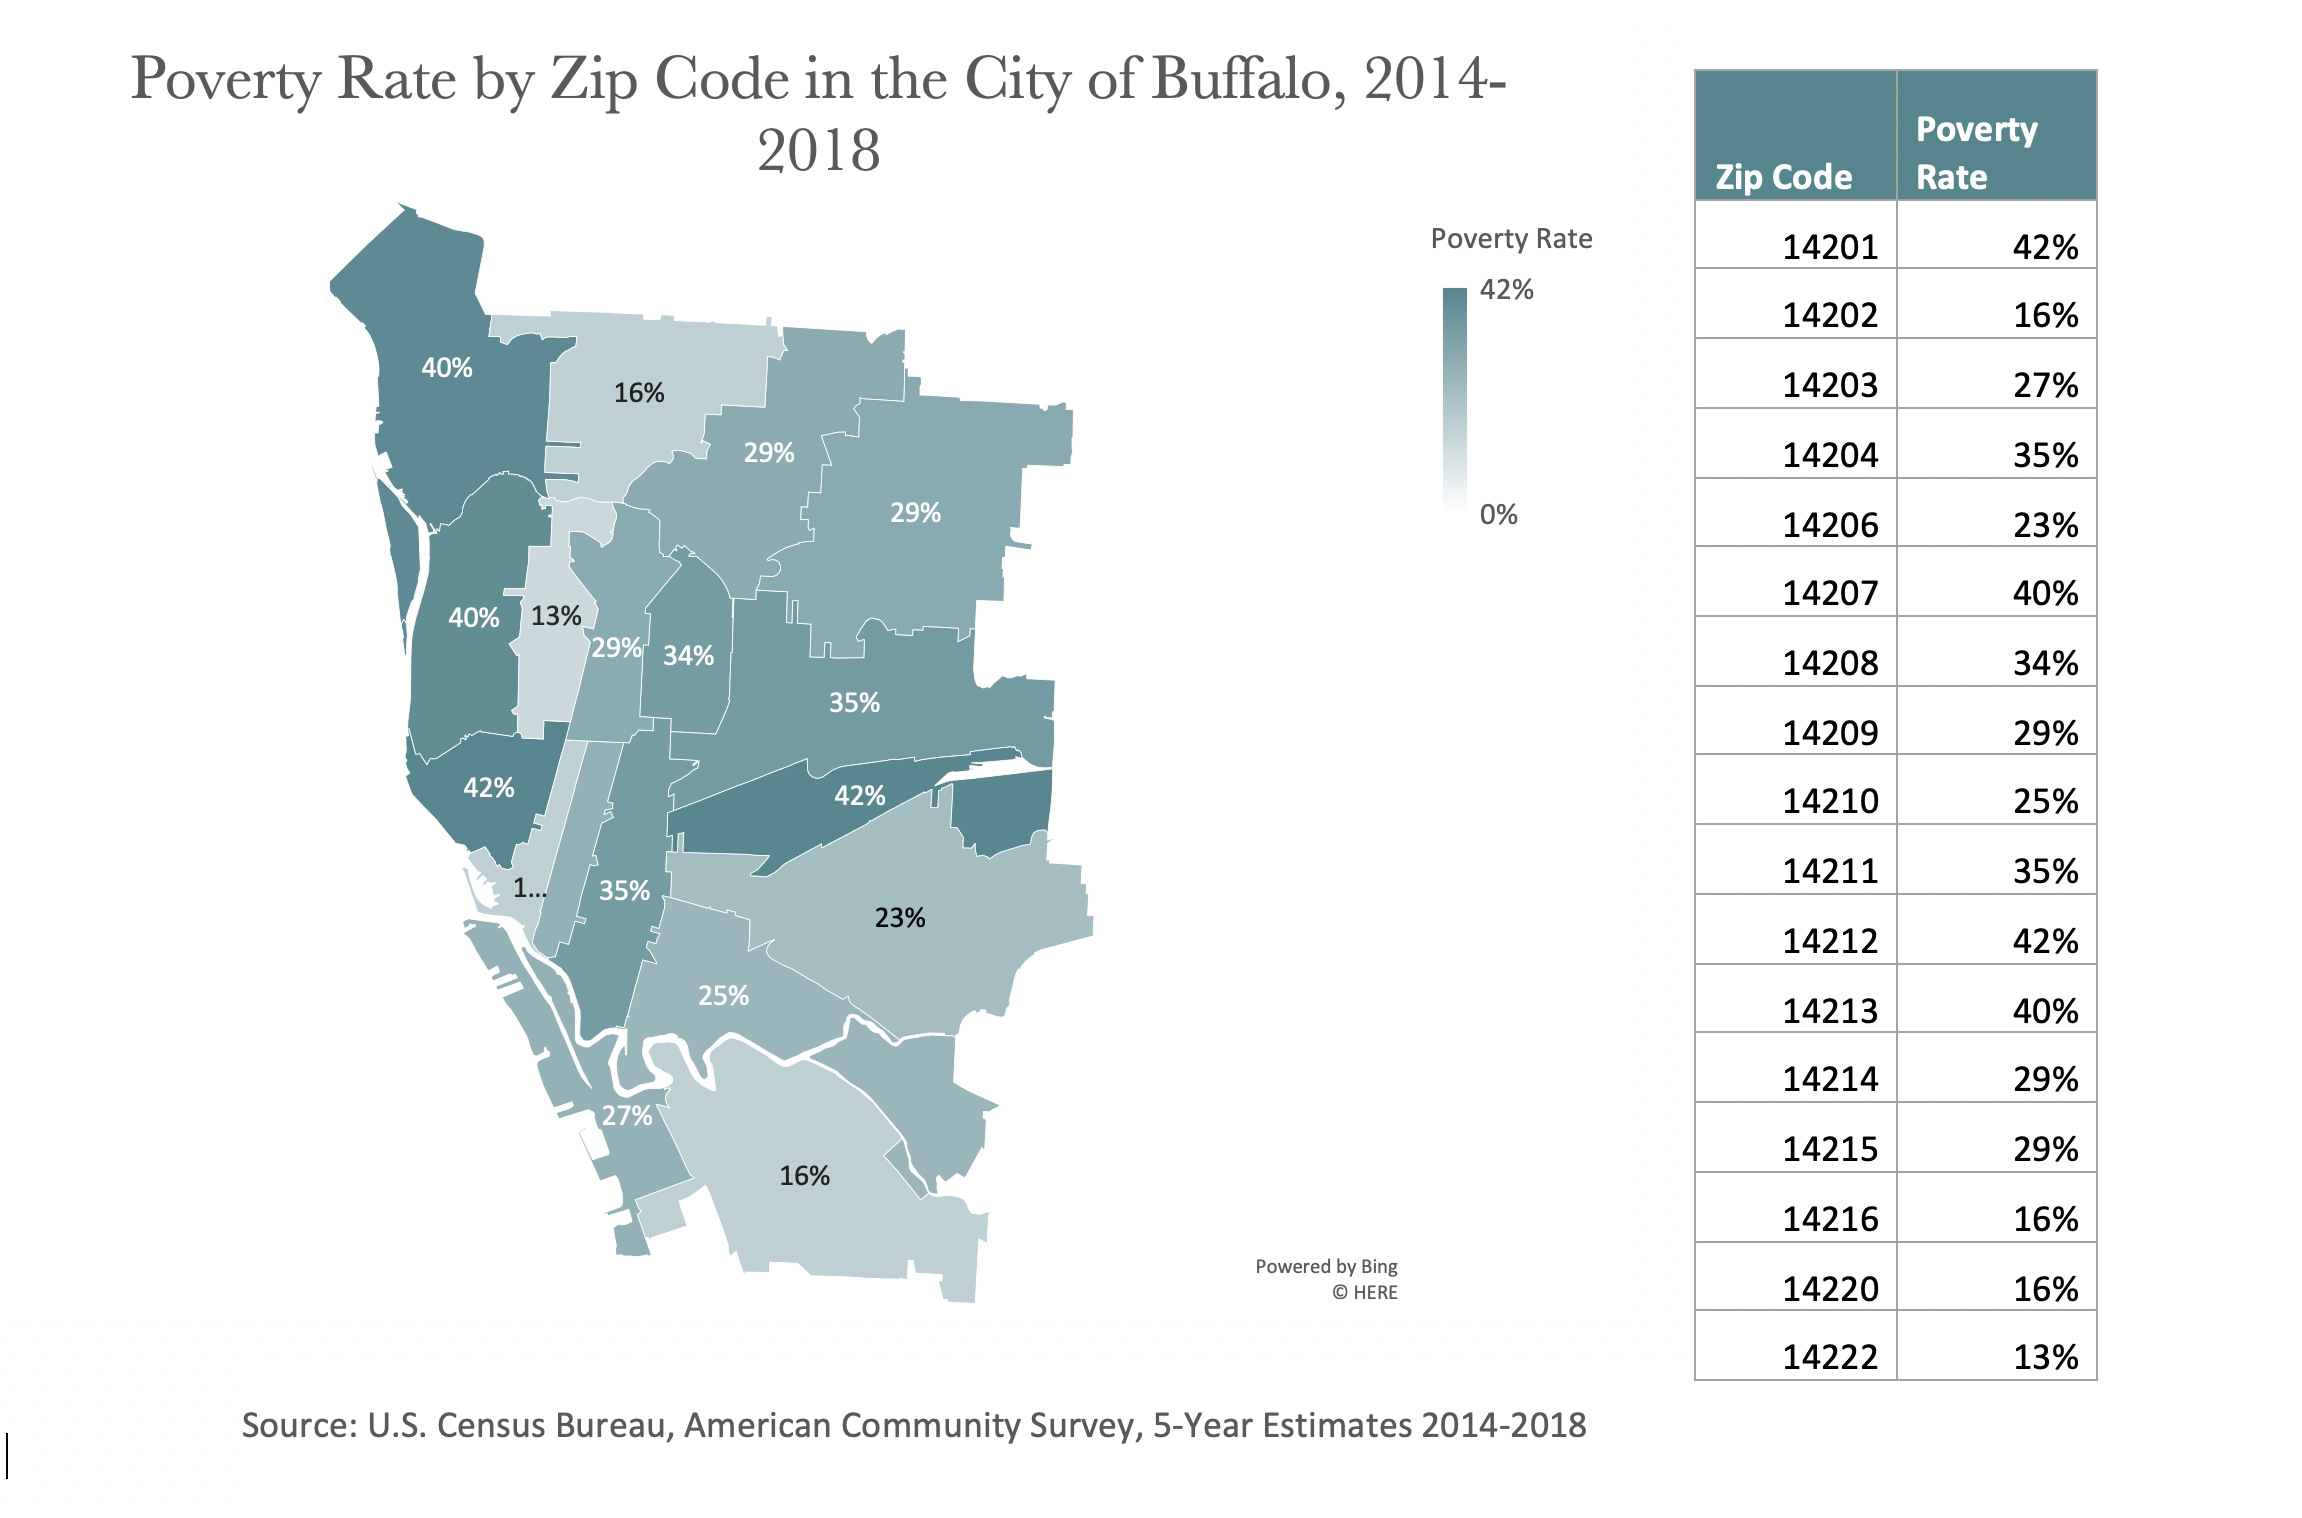
Poverty in Erie County is largely concentrated in the city. In city zip codes with the highest COVID-19 rates, poverty rates range from 29% to 40%. The city-wide poverty rate is 30%. In city zip codes where we see the lowest poverty rates (14222, 14220, 14216, 14202), we also see COVID-19 rates below the county-wide average of 4.8 cases.
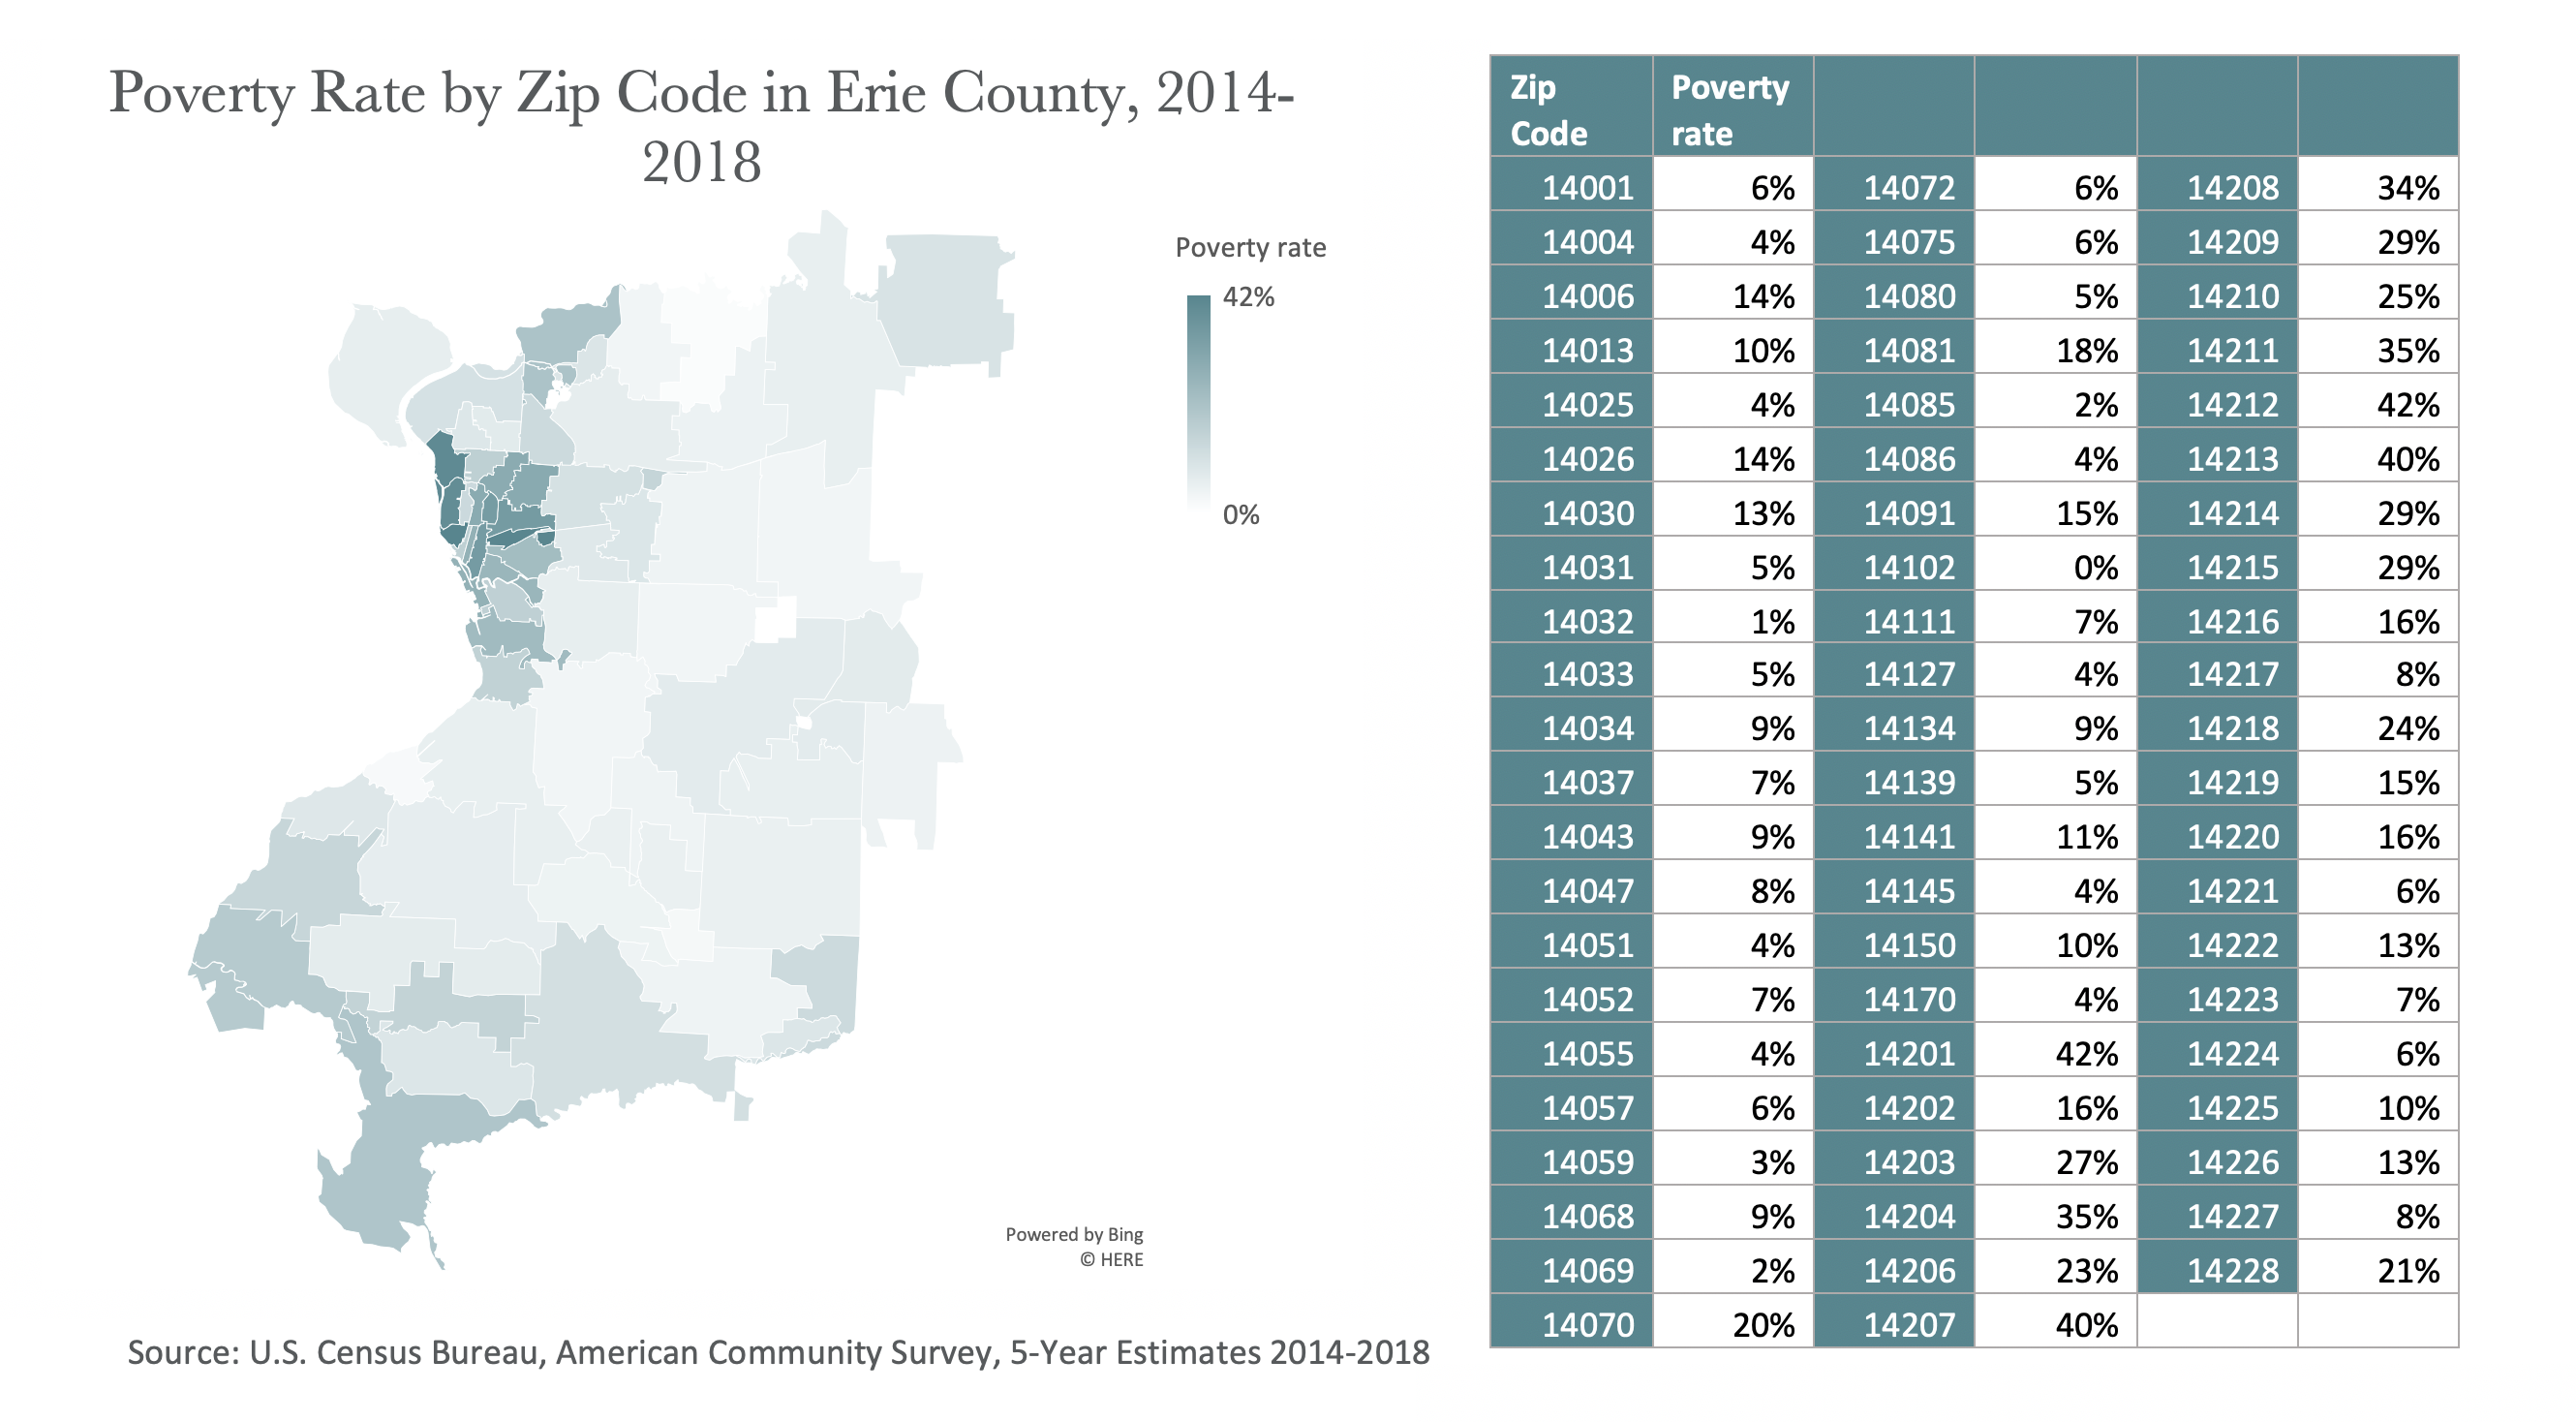
Outside of the city, only one of the zip codes with the highest COVID-19 rates (14026, Bowmansville, 6.8 cases) has a poverty rate that edges close to the county-wide poverty rate of 14.5%. The rest have poverty rates below 10%.
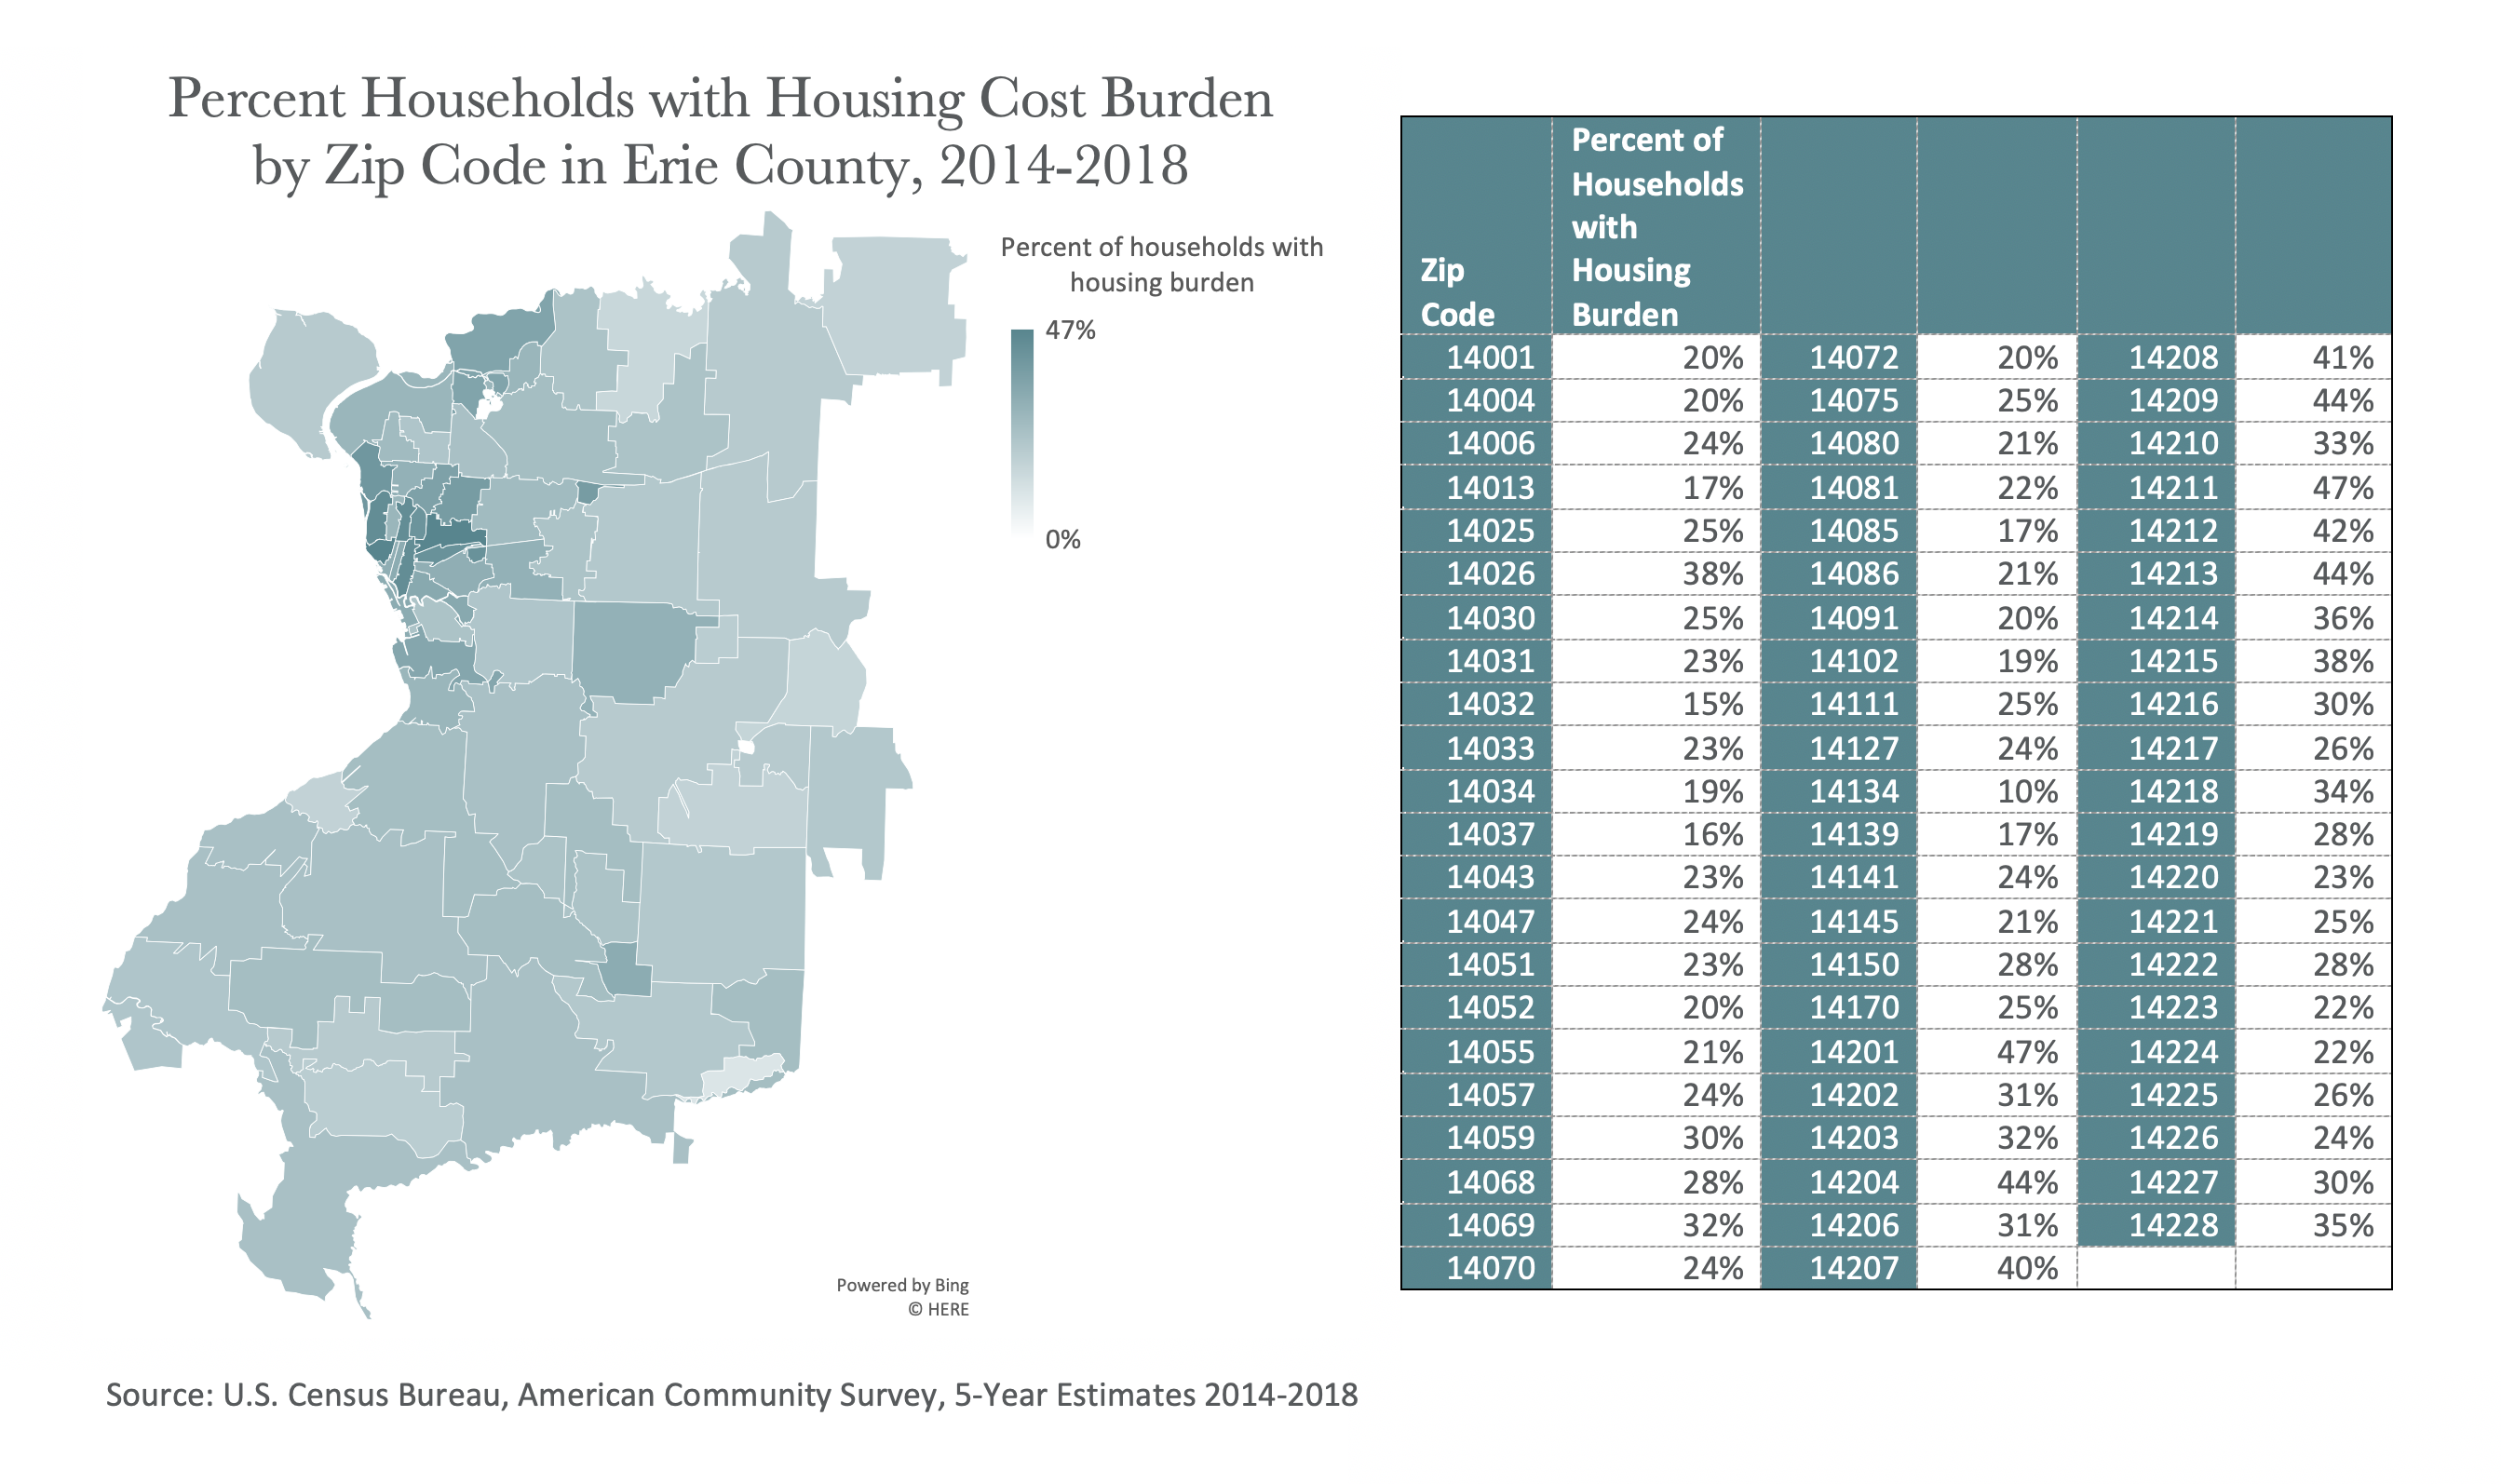
Housing Cost Burden
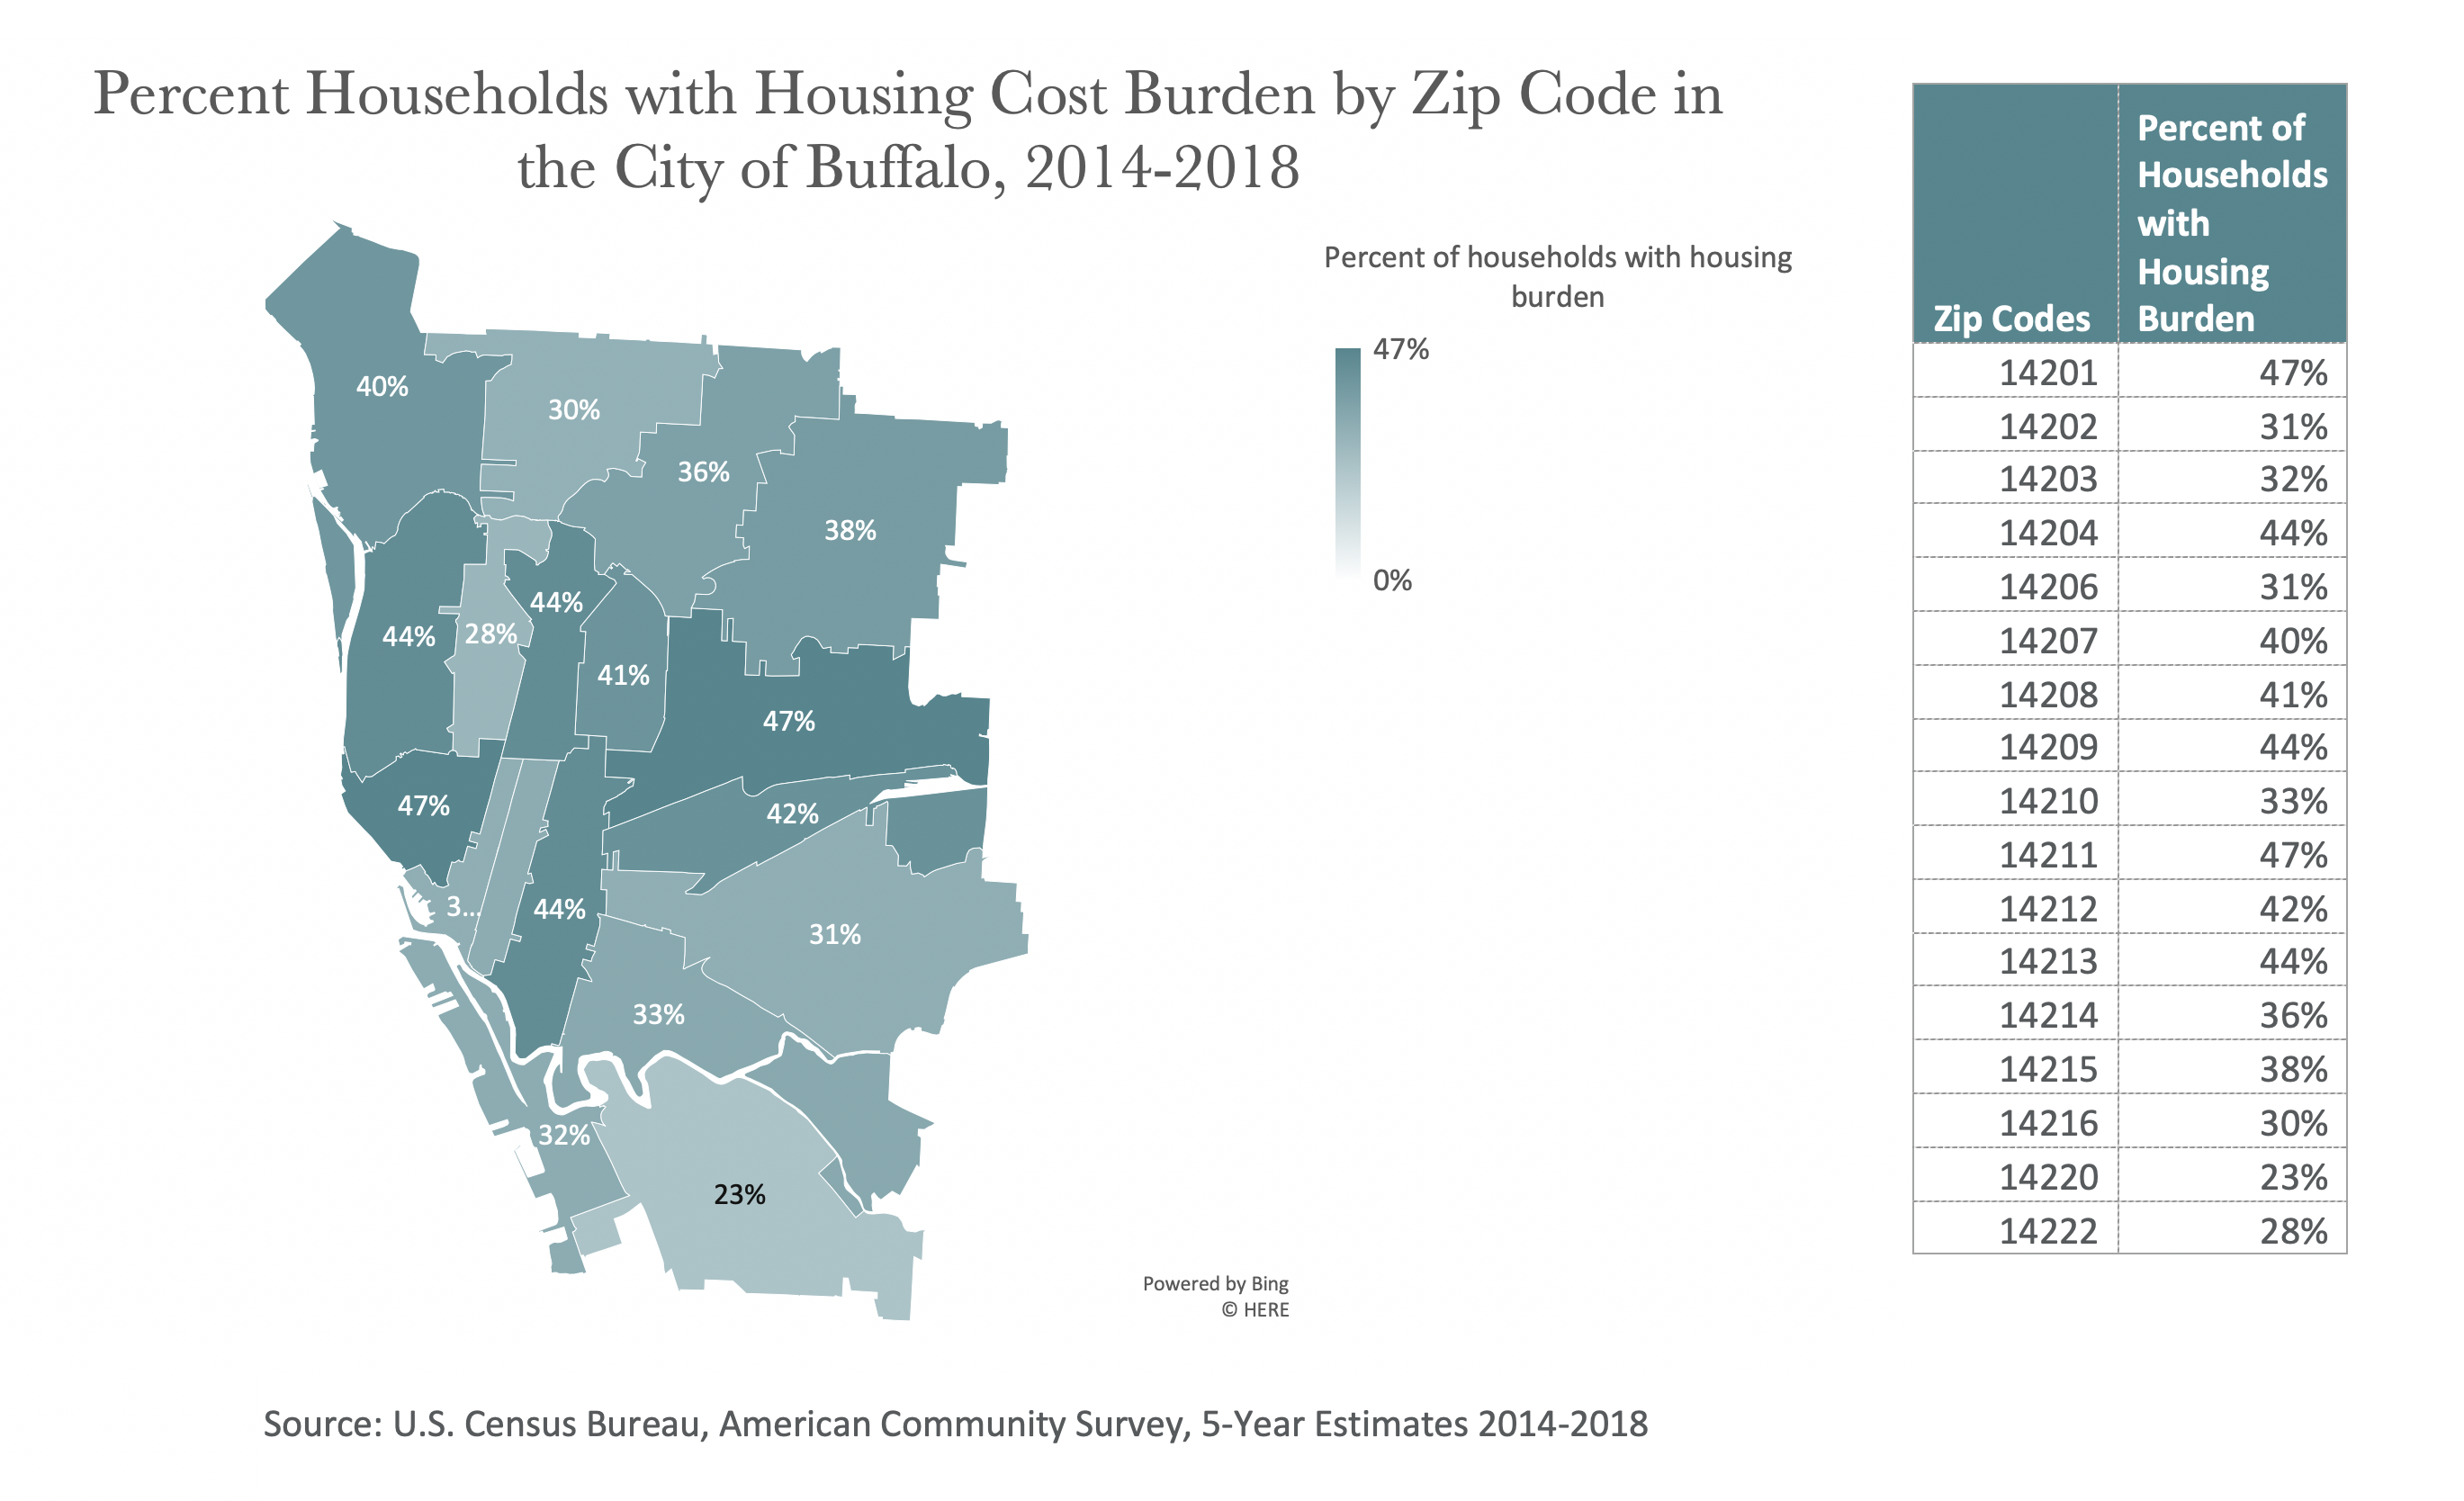
A housing burden is defined as a household paying more than 30% of their income on housing costs. Here we’re looking at both homeowner and renter households.
Within Buffalo, 4 of the 5 zip codes with the highest COVID-19 rates (all except 14215) have housing cost burdens higher than the city-wide average of 40%. In the city zip codes with the lowest housing burdens (14220, 14222 and 14216), COVID-19 rates are below the county-wide average of 4.8 cases per 1000 residents.
Outside the city, in zip codes with the highest COVID-19 rates, housing burdens vary drastically. Zip code 14026 (Bowmansville) has the highest housing burden 38%, while zip code 14134 (Sardinia) has the lowest housing burden in the county at 10%.
For both county and city data, the COVID-19 case rate correlates with the percent of households with a housing burden. Where more households face housing cost burdens, the rate of COVID-19 is higher.
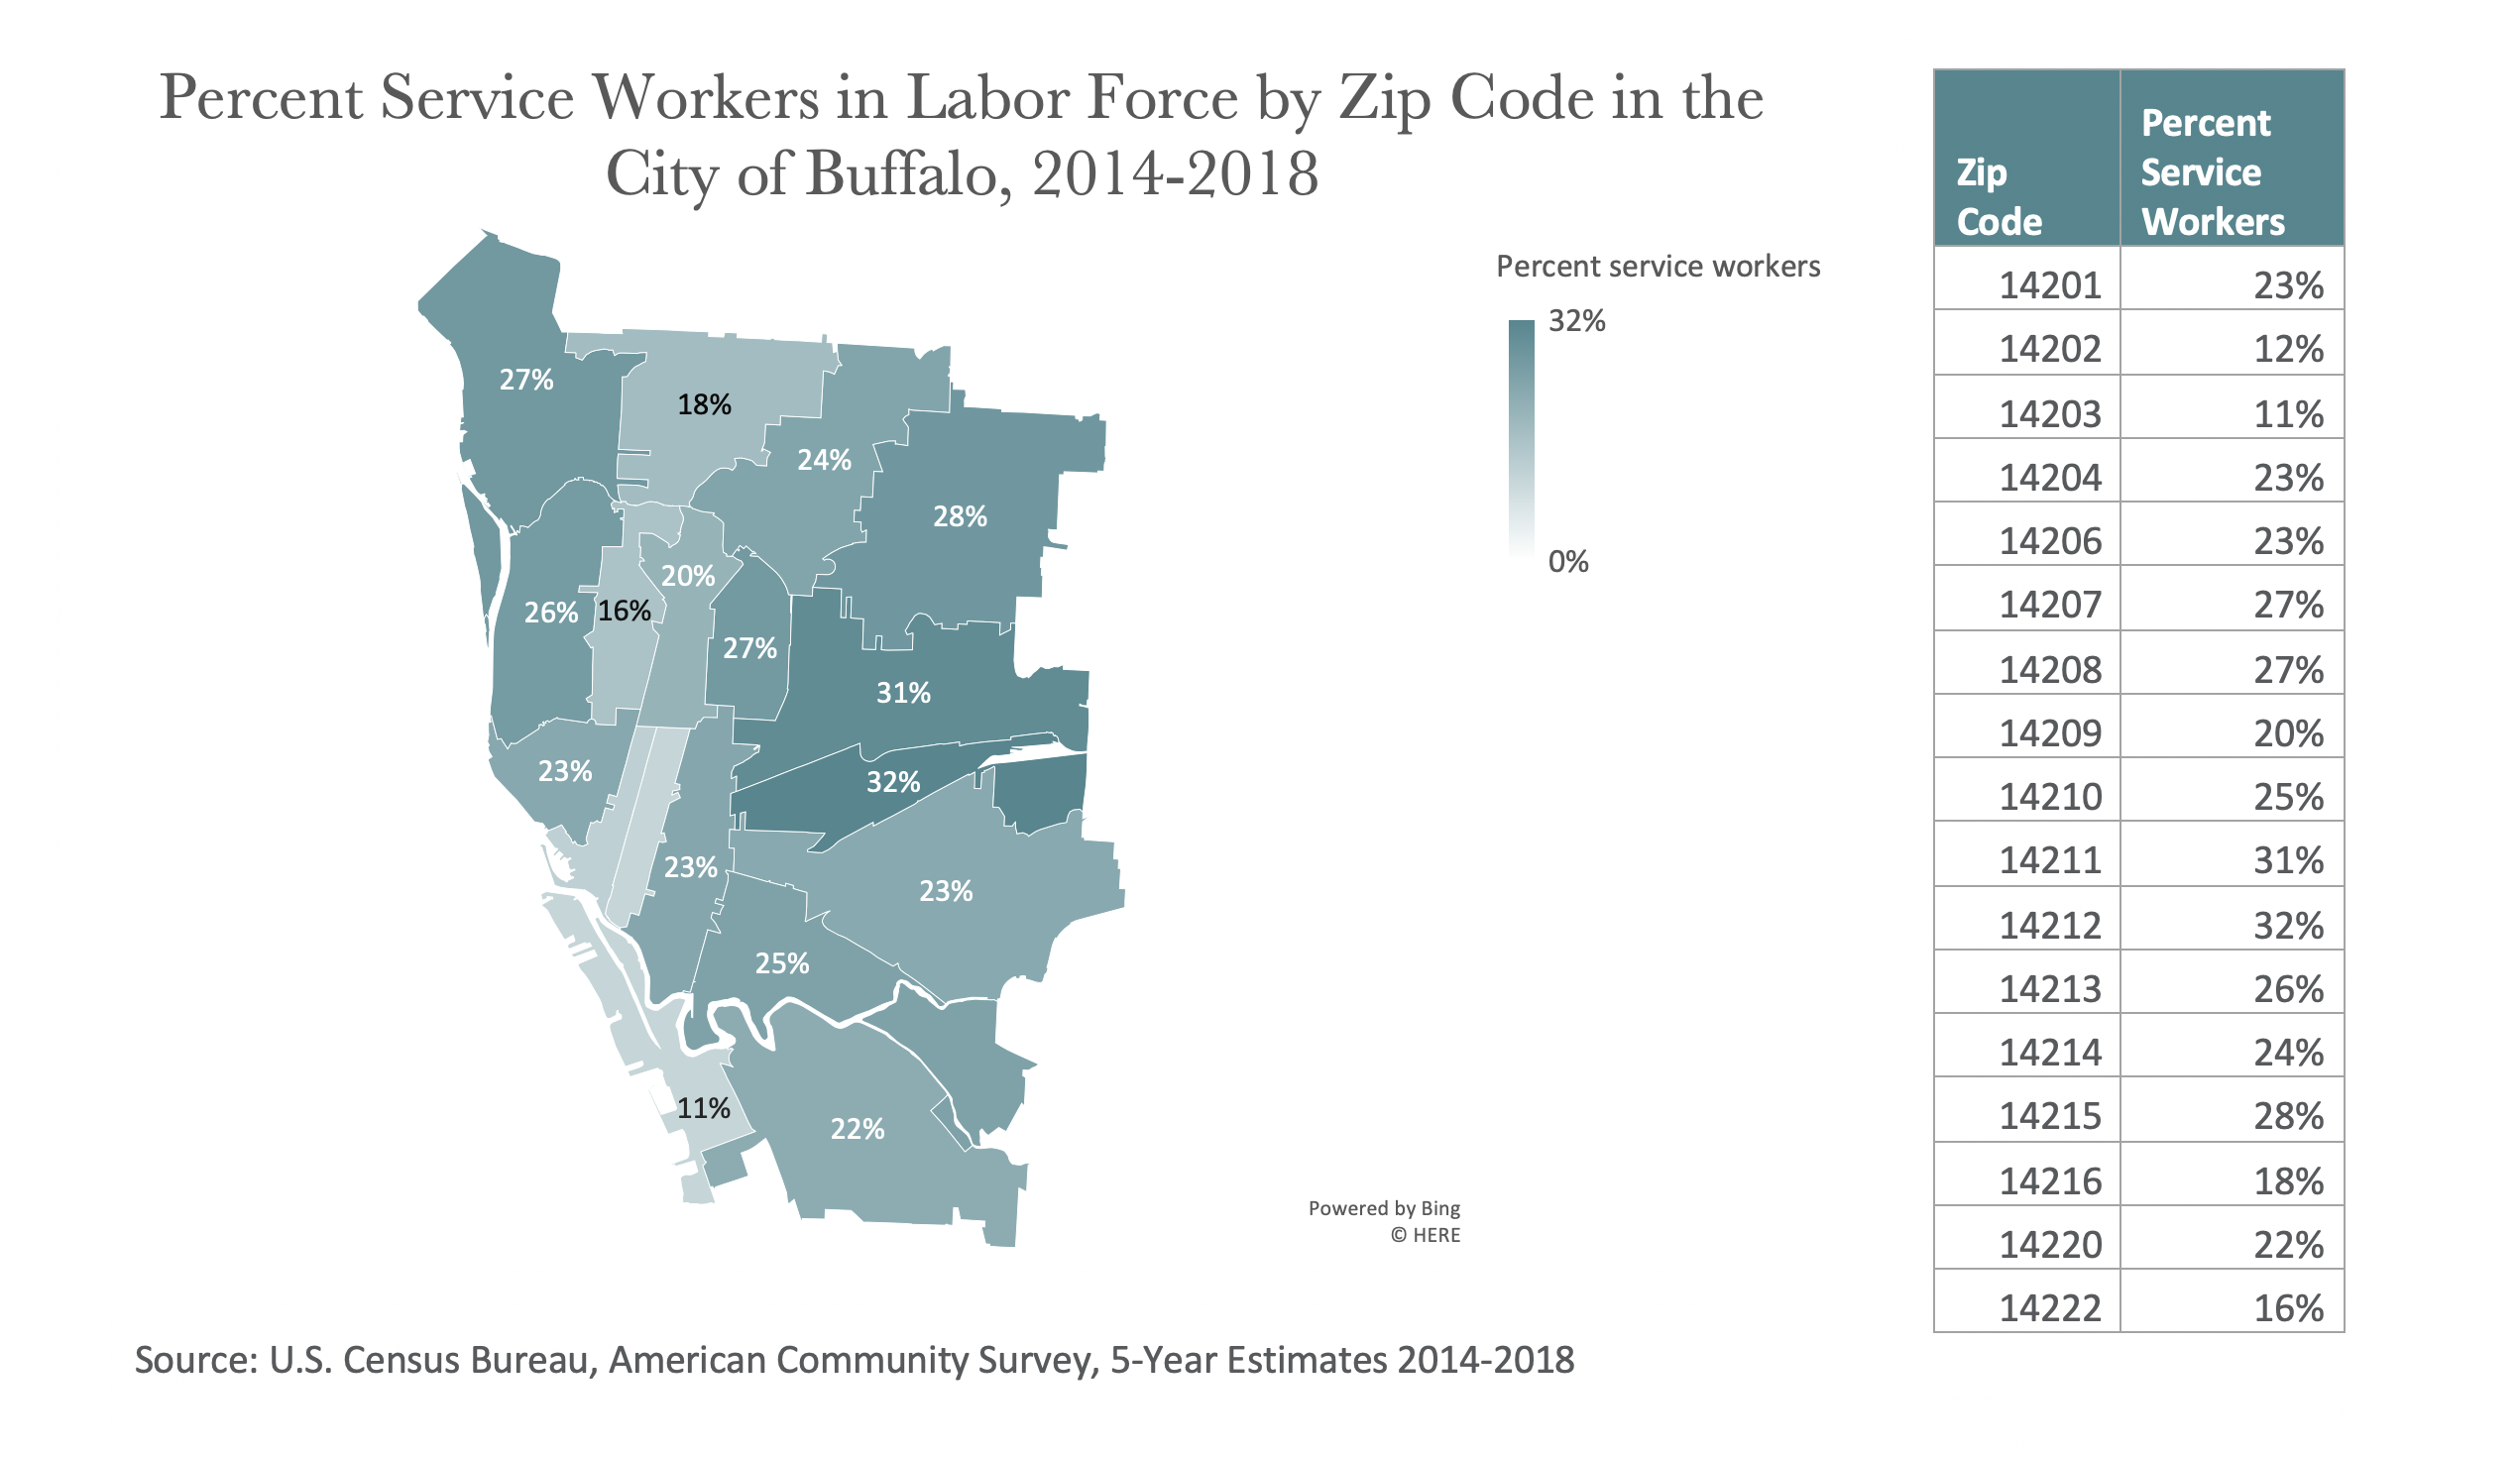
Service Workers
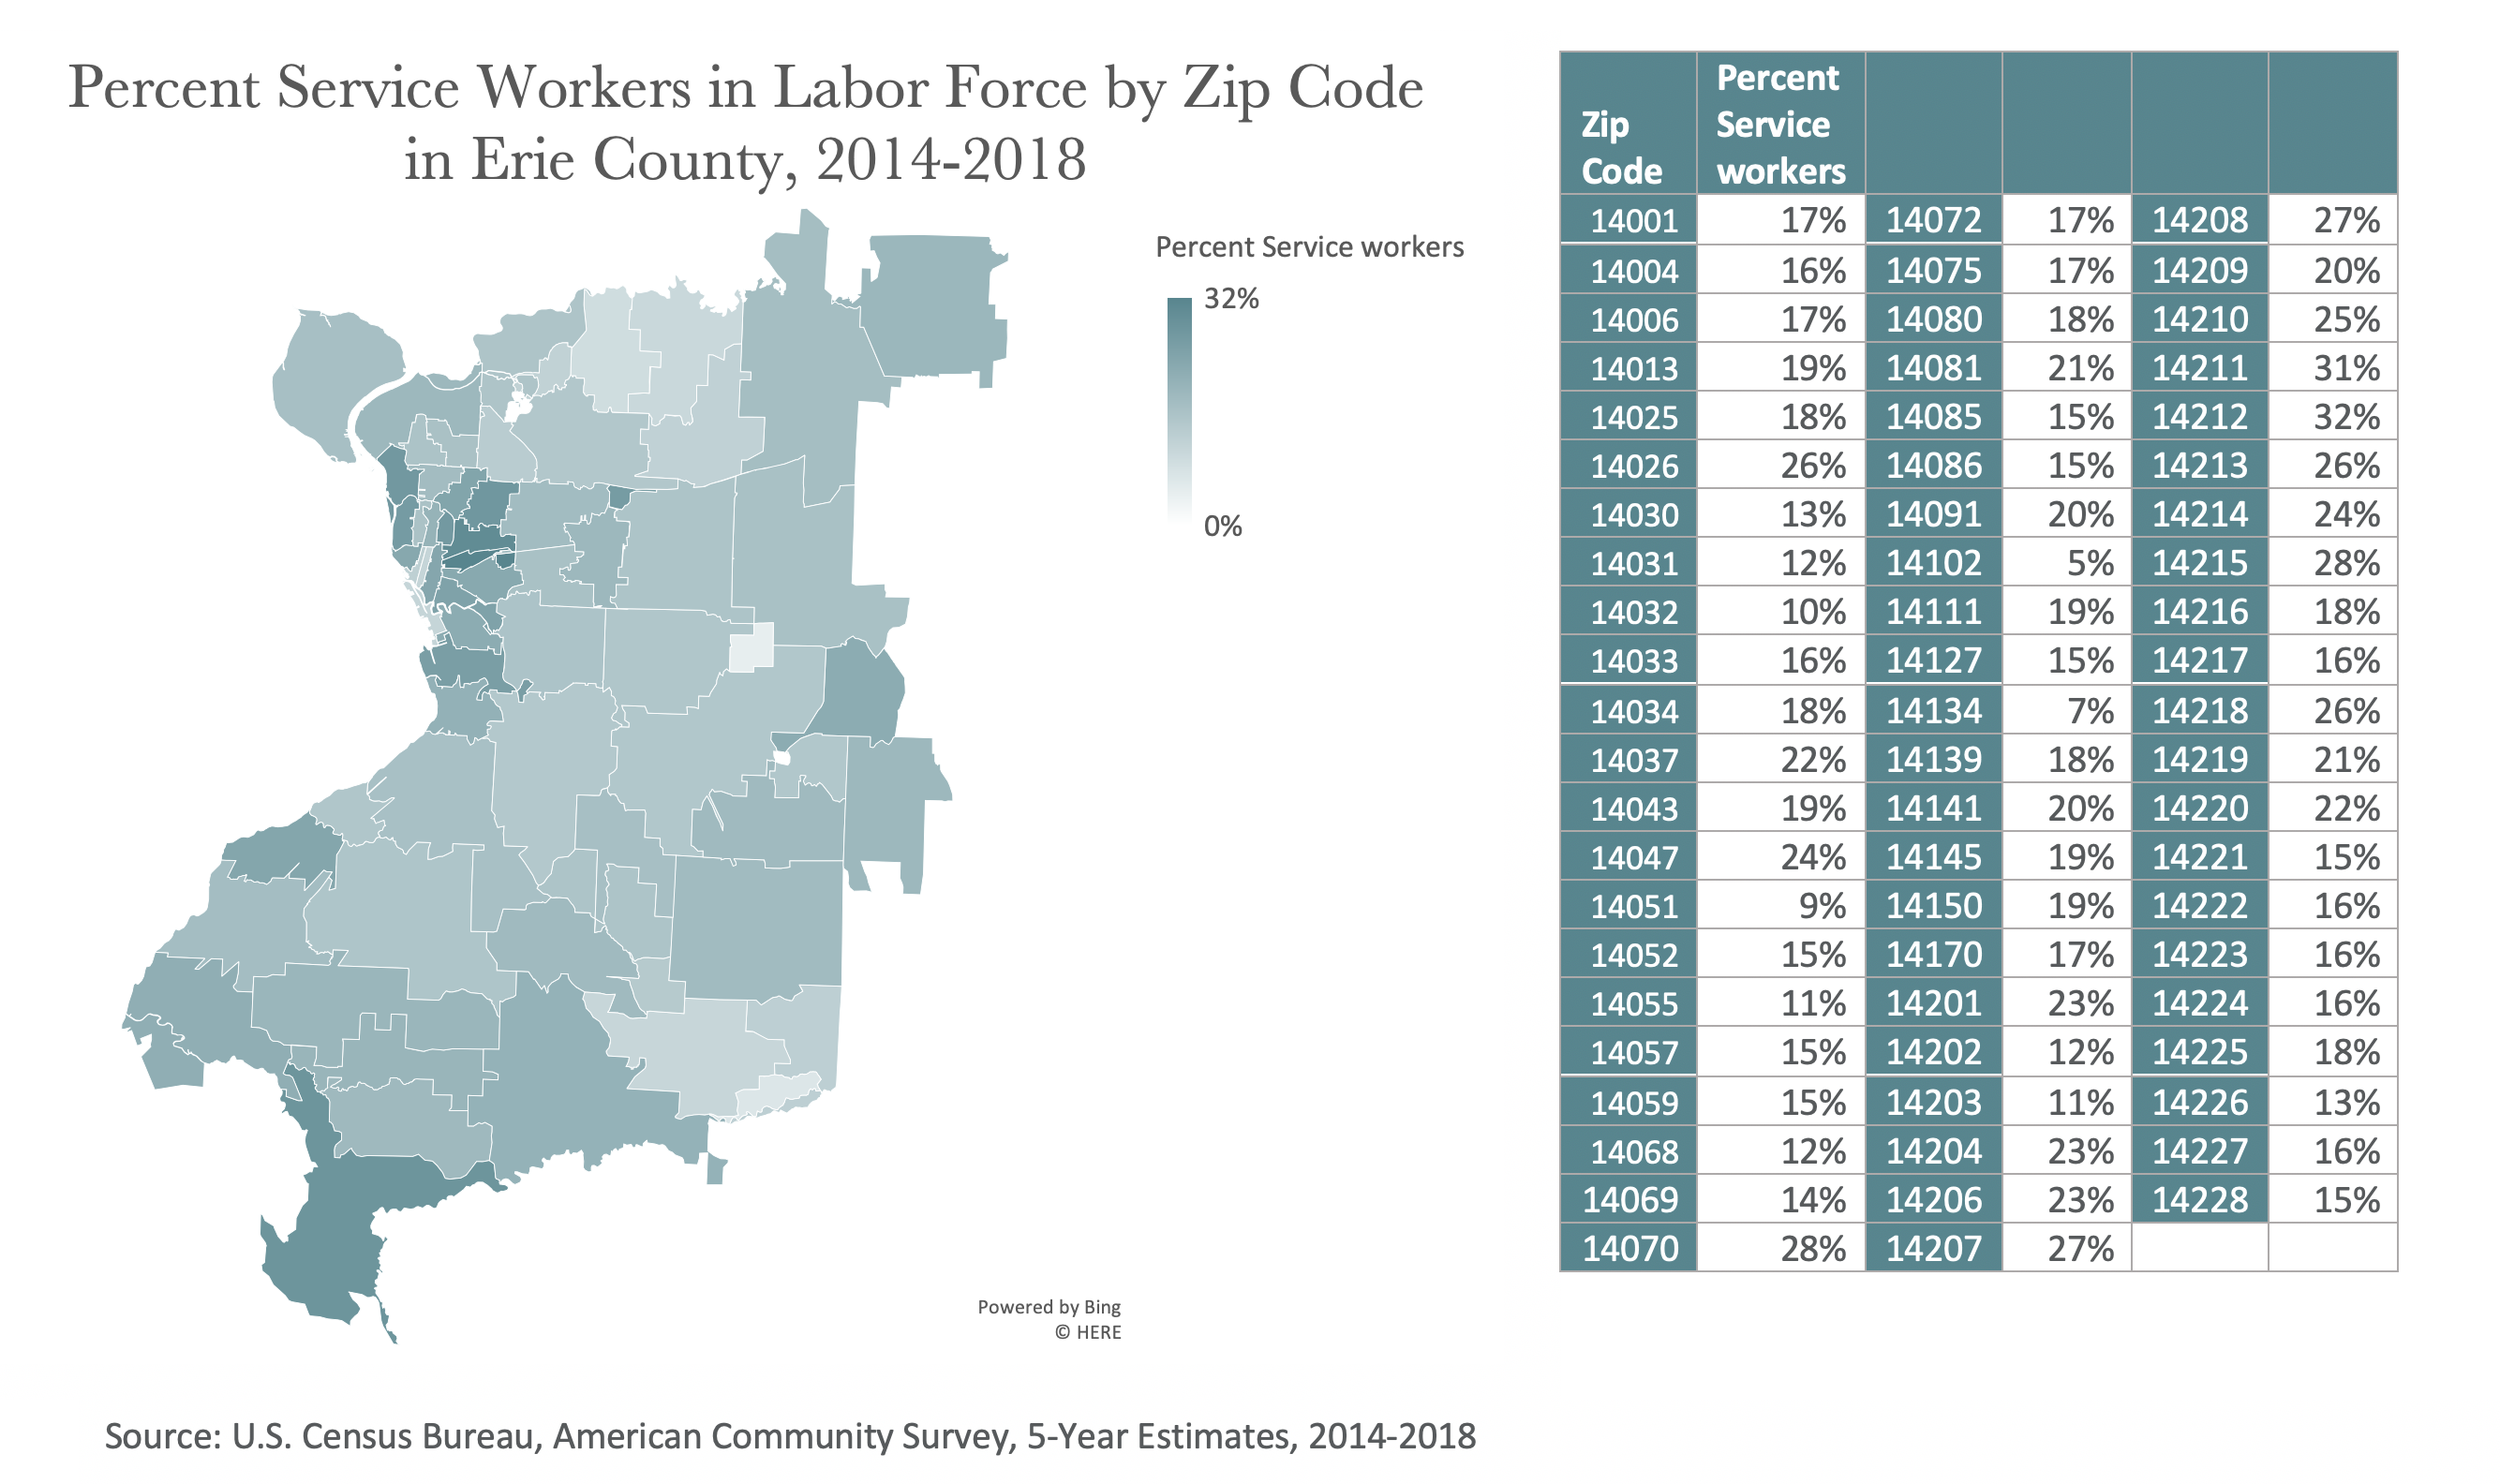
We also looked at COVID-19 rates as they relate to percentages of service workers living in each zip code. In this data set, service occupations include healthcare support, food preparation and serving, personal care, cleaning and maintenance, among others.
Four of the five Buffalo zip codes with the highest COVID-19 rates also have a population of service workers that is higher than the city average (24%).
For Erie County zip codes outside of Buffalo with the highest COVID-19 rates, service worker population really varies. Zip code 14134 (Sardinia) has the lowest percentage of service workers in the entire county, while zip code 14026 (Bowmansville) has one of the highest percentages of service workers outside of the city at 26%.
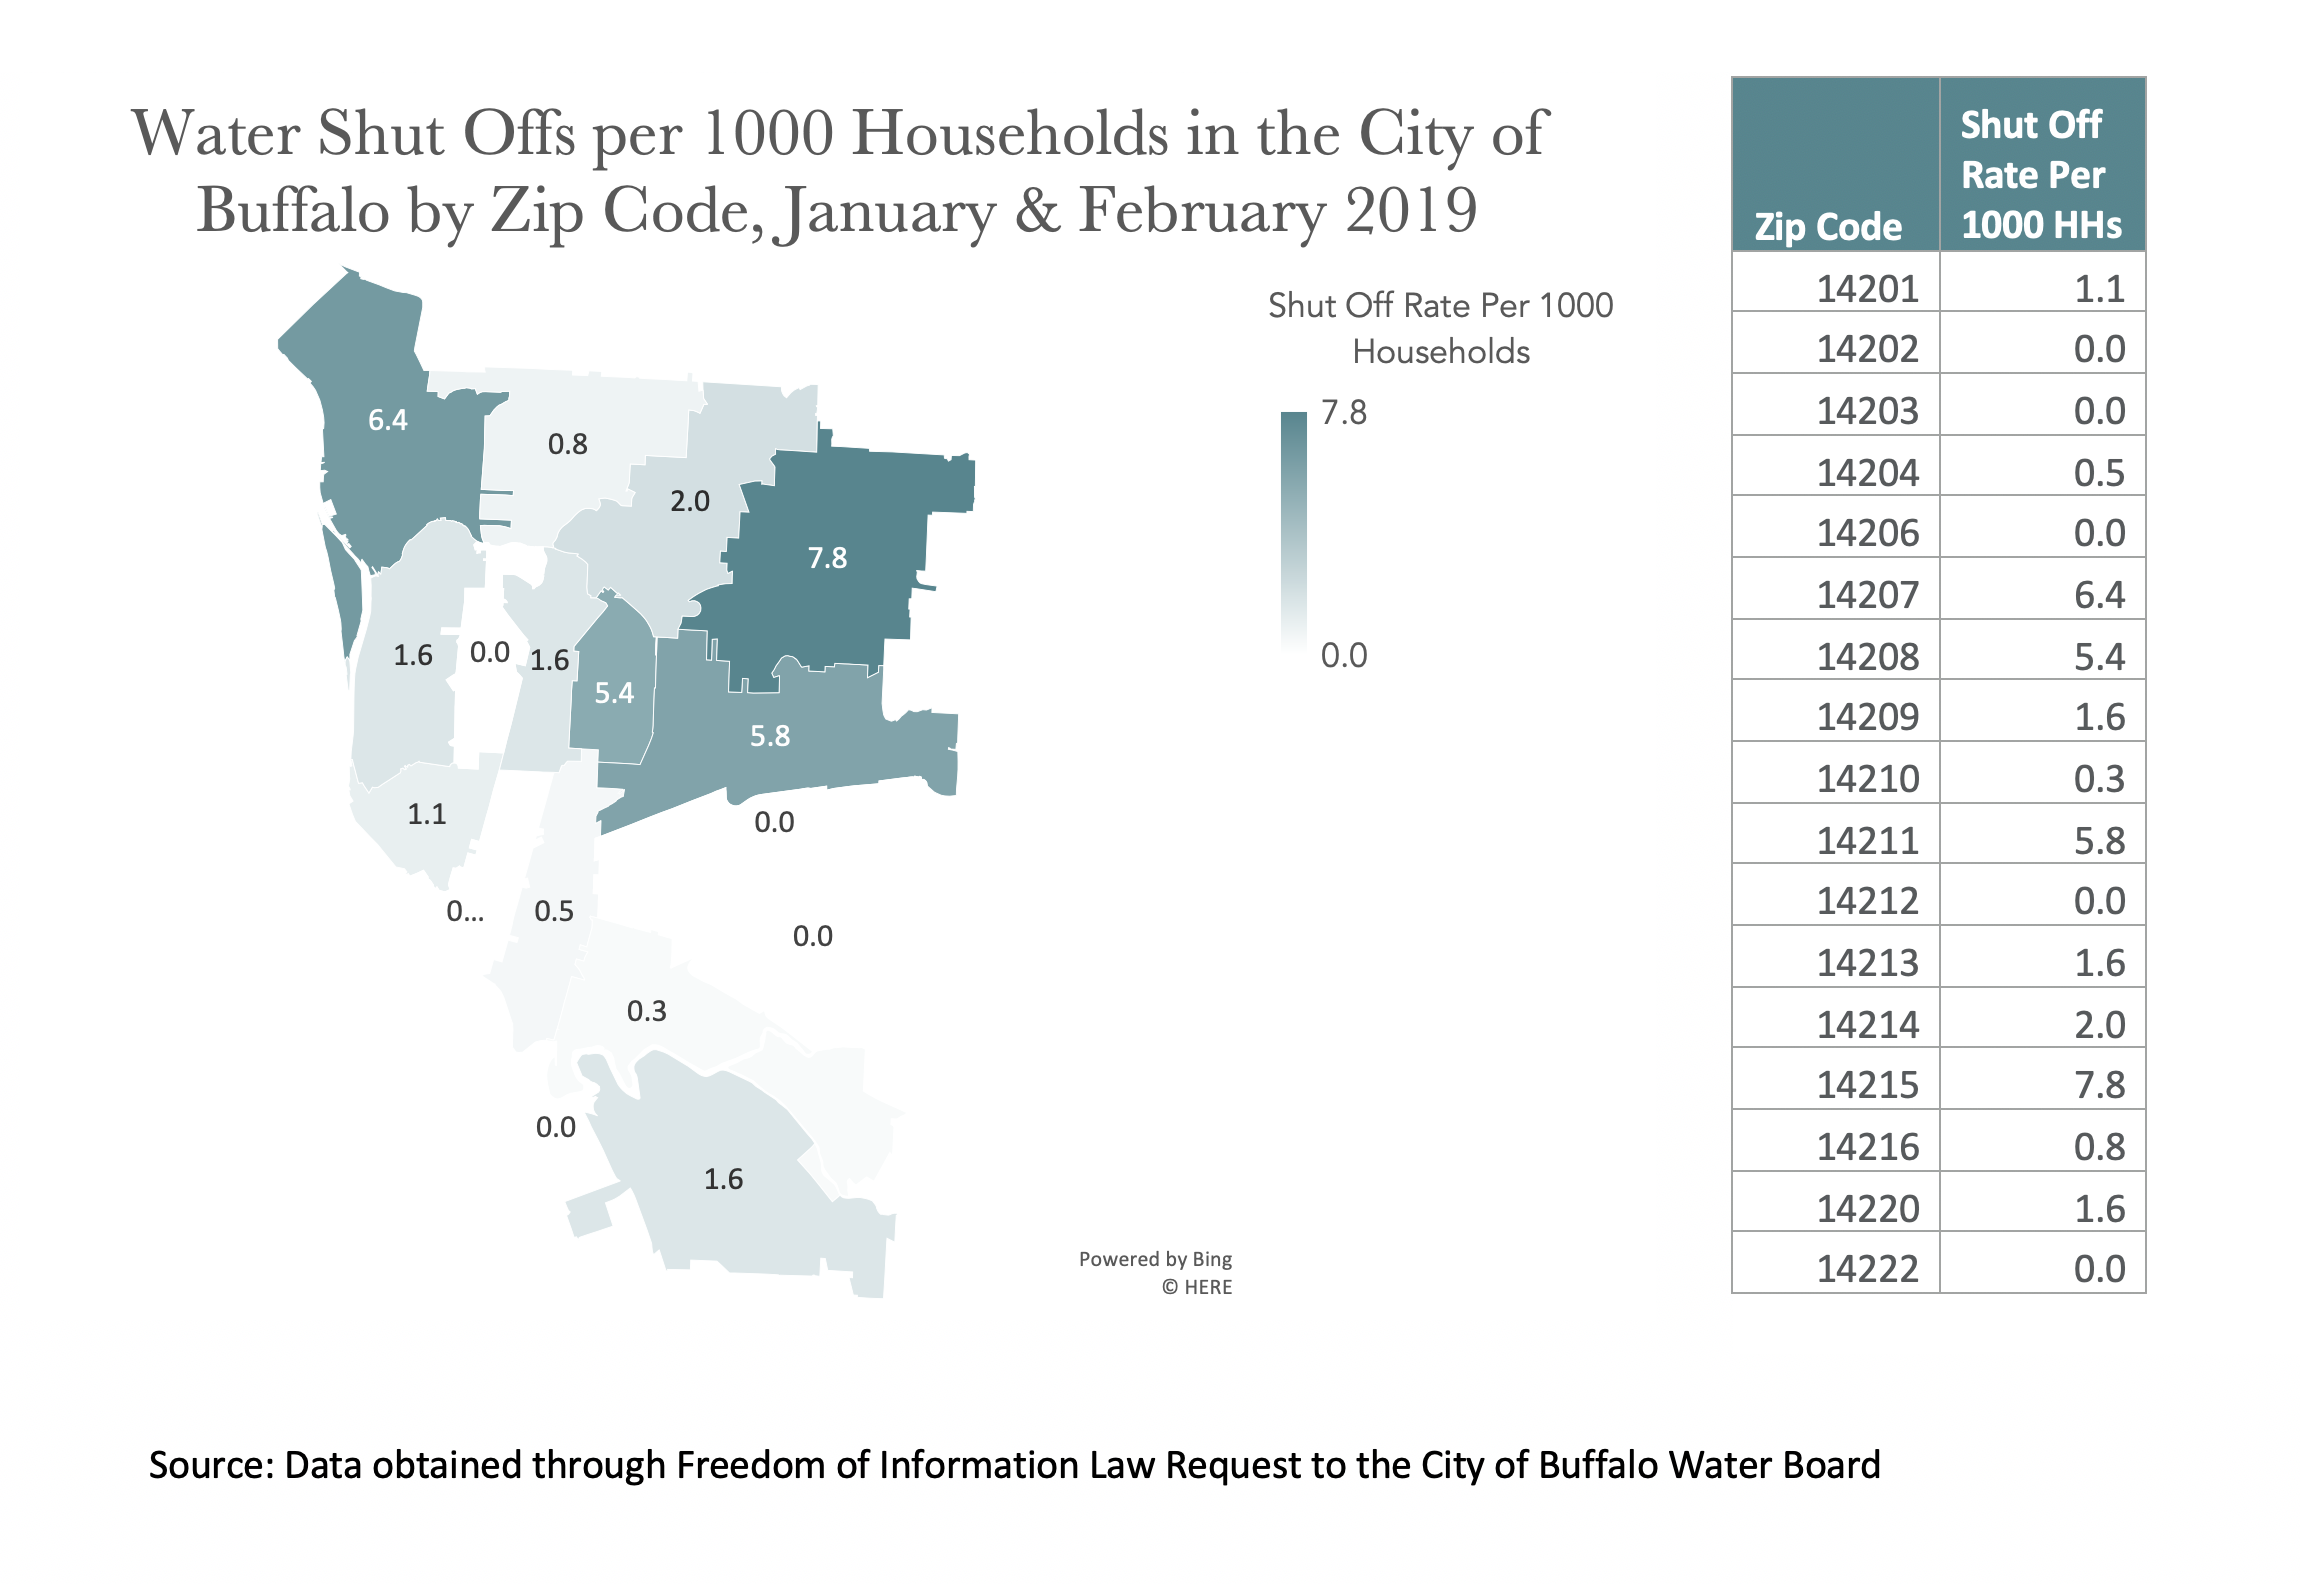
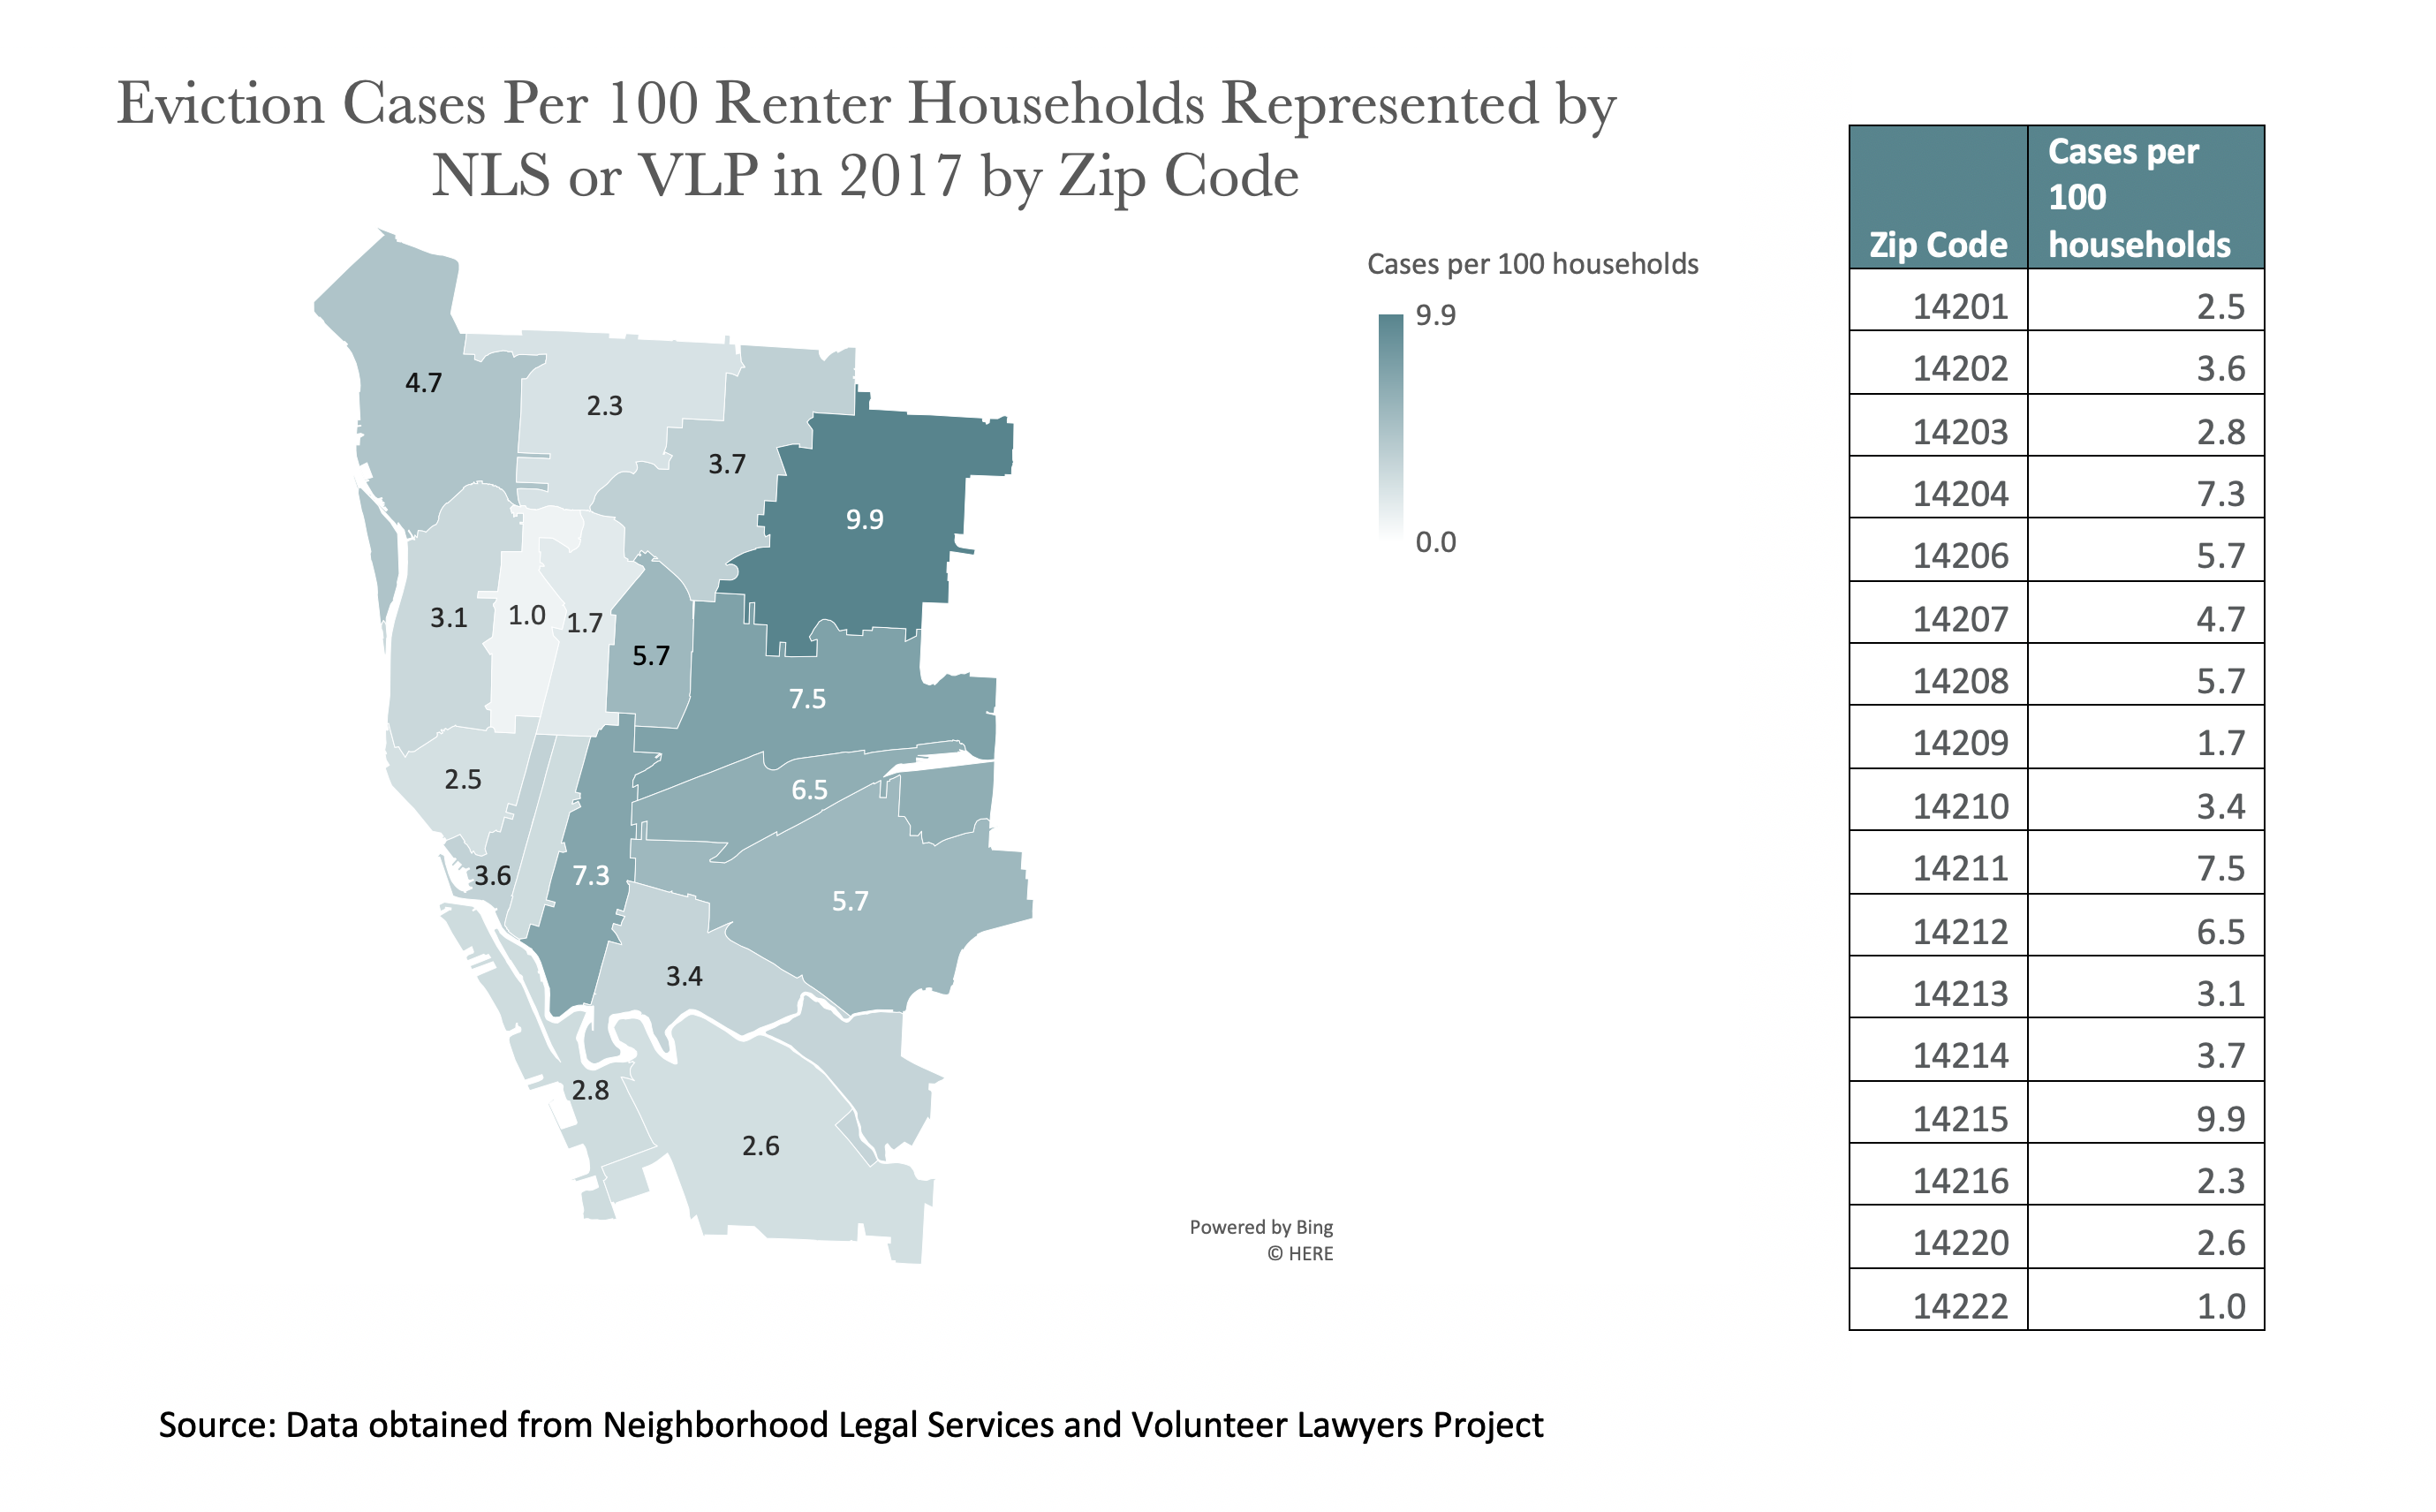
Evictions and Water Shut Offs
Available data on evictions and water shut offs in the City of Buffalo is limited. For evictions, our dataset includes cases where the tenant appeared in court and was represented by a legal services provider. For water shut offs, our dataset includes only January and February 2019.
Of zip codes where COVID-19 rates are the highest, four of five zip codes have eviction case rates at or above the city-wide average of 4.7 cases per 100 households. Interestingly, the zip code with the highest COVID-19 case rate (21.6) has one of the lowest eviction case rates in the City.
Turning to water shut offs, of zip codes where COVID-19 rates are the highest, the same four of five zip codes have shut off rates higher than the city-wide rate of 2.8 shut offs per 1000 households. These four zip codes (14208, 14215, 14207, and 14211) in fact have the highest shut off rates in the entire city.
Summary
COVID-19 cases are not evenly distributed across Erie County. Certain zip codes within the City of Buffalo and outside seem to be hot spots, based on testing data available so far.
Within Buffalo, some of the zip codes with the highest COVID-19 rates also struggle with high rates of poverty and poverty-related issues such as housing burden, evictions, and water shut offs. As we know from city-wide data, these issues fall disproportionately on residents of color within Buffalo, so it is no surprise that these same zip codes have populations that are majority folks of color. Most of these zip codes also have higher populations of service workers than the city-wide average. Interestingly, the city zip code with the highest COVID-19 rate in the entire county, 14209, has a below-average population of service workers, eviction rate and water shut-off rate. Its poverty rate is about average, though it does have a higher than average housing burden rate.
Outside of Buffalo, most zip codes with high COVID-19 positive case rates do not have especially high rates of poverty, housing burden or service workers. However, zip code 14206 (Bowmansville) is an exception with a higher population of service workers and households with housing burdens than most of the other zip codes outside of the city.