News Take Action
WKBW: "Redlining: How racial discrimination hobbled Black homeownership in Buffalo"
| Date: | September 1, 2021 |
| Share: |
By Charlie Specht, Sean Mickey | Sep 01, 2021
When Pastor George Nicholas steps outside his church in Buffalo’s Masten District, he sees a steady stream of cars making their way down Main Street.
But what Nicholas is really looking at is Buffalo’s invisible dividing line.
To the west is the Elmwood Village, a majority-white area where the medium household income is $51,000 per year. Nardin Academy, Canisius High School and the Saturn Club are less than a mile away.
East of Main Street is where 85 percent of Black Buffalonians live. There -- in a U.S. Census tract roughly the same geographic size as three tracts on the west of Main -- the median household income is just $24,000 per year.
“There’s almost been this acceptance of this as, ‘Oh, that’s just the way Buffalo is,” said Nicholas, pastor of Lincoln Memorial United Methodist Church.
But this stark disparity did not happen organically. If it seems that people looked at a map and drew lines down Main Street dividing the “haves” from the “have nots,” it’s because they did.
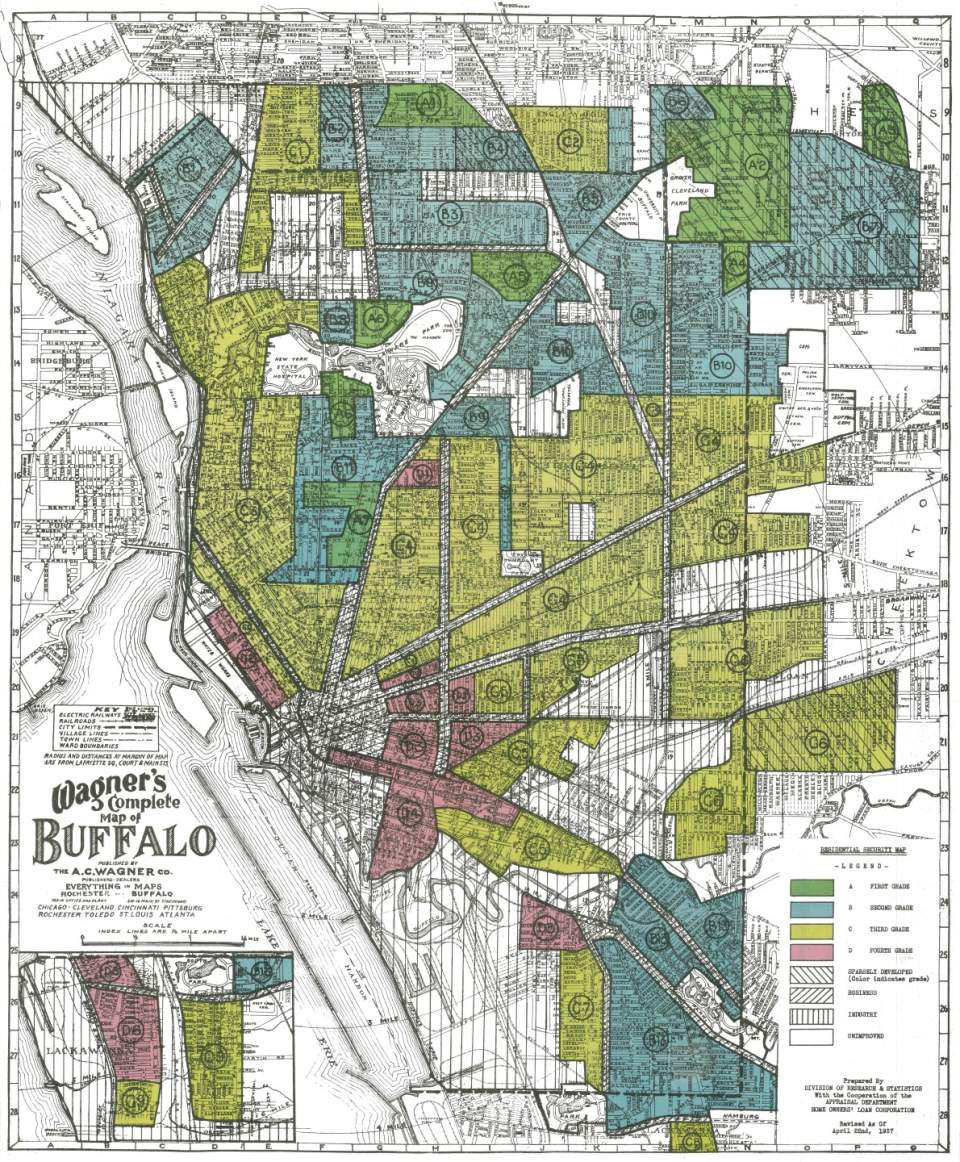
Maps drawn in 1937 for the Home Owners’ Loan Corporation -- a federal government agency -- were used by the mortgage industry for decades to deny mortgages in areas where poor people and residents of color lived, a practice known as “redlining.”
“So the federal government created these maps all around the country, these underwriting maps, and they said, ‘Here's where we'll underwrite mortgages and encourage them and here's where we'll discourage them,’” said Sam Magavern, senior policy fellow at the Partnership for the Public Good, a Buffalo nonprofit organization.
How Buffalo was redlined
The maps -- published online as part of the “Mapping Inequality” project between the University of Richmond, University of Maryland, Johns Hopkins University and Virginia Tech -- were color-coded by the level of “mortgage security” that HOLC staff and local real estate professionals estimated in those areas.
Areas shaded in green -- that meant Delaware Avenue, pockets of North Buffalo and some of the region’s first suburbs -- were deemed “best” for mortgage lending because they had “many magnificent homes on large plottages which are still being maintained by the leading families of Buffalo.”
But any sort of ethnic diversity was a drawback in the eyes of appraisers.
For instance, the western part of Elmwood -- on Ashland and Lafayette Avenues -- was downgraded by one level to blue because mapmakers warned that there was an “infiltration of mixed races” beginning to take place.
A large swath of Buffalo’s East Side running from downtown to the Cheektowaga line along Genesee Street was shaded yellow, meaning the mapmakers determined it to be “definitely declining.”
The area was on a “general downward trend through infiltration of lower income groups and foreign born,” they wrote.
One thing the area had going for it, the mapmakers stated, was the ethnicity of its residents: mostly Polish and German, which they described as “a substantial type of citizen.”
But a few blocks to the south -- an area stretching from Broadway down to where Sahlen Field now stands -- is shaded not yellow, but red. That area was deemed a “hazardous” place for bankers to lend, in part because of what officials deemed the “type of occupant.”
“An extremely old section which has been taken over by Italians and Negros of a poor type,” the map reads.
Nicholas’ church sits on the edge of the Cold Springs area, which -- unlike the majority-white neighborhoods bordering it on all sides -- was redlined and deemed “hazardous” for mortgage lending because of what mapmakers called the “infiltration” of Black people.
“It was the institutionalization of white privilege,” said Henry Louis Taylor Jr., director of the Center for Urban Studies at the University at Buffalo.
Taylor said the maps and banking practices that followed were based on an inherently racist economic principle created by the real estate industry and sanctioned by the government.
“Blacks drive value down,” he said, describing the thinking of the time. “Since Blacks drive value down, the secret to creating white value is by isolating them from Blacks.”
Economic and social impact
In a country in which owning your own home is one of the most common ways to build equity, the effects of such policies were devastating, academics and community leaders say.
“It impacts the ability to acquire wealth and the ability to transfer wealth, which is the American dream,” Nicholas said.
More than 80 years later, such blatantly racist policies have changed. But the disparities in wealth that they enabled are striking.
The Urban Institute in 2018 said Buffalo had the third-highest homeownership gap in the nation, with 73% of white people owning their own homes compared with just 29% of Black people.
“It's the single biggest reason that there's such a huge wealth gap in this country where the average white family has about 10 times the net wealth of the average African-American family,” Magavern said. “Ten times. That's a huge, huge difference.”
Redlined neighborhoods on Buffalo’s East Side entered into a spiral of disinvestment where “the lack of hope and opportunity creates a whole ‘nother set of issues,” Taylor said.
Neighborhoods of color differ from predominantly white neighborhoods in how likely residents are to be exposed to pollution, live near a highway, be surrounded by blight and vacancy, be underserved by banks, and have less access to supermarkets, according to the UB Regional Institute.
Researchers who digitized the redlining maps have also found significant ties between neighborhoods of color that were redlined and those that were disproportionately affected by the Covid-19 pandemic.
“These places, they kill people,” Taylor said. “Because they cause unnecessary disease, death, and dying.”
Read the rest of the article on the WKBW website here.