News Take Action
New Fact Sheet on Rental Housing Costs in Buffalo
| Date: | October 15, 2018 |
| Share: |

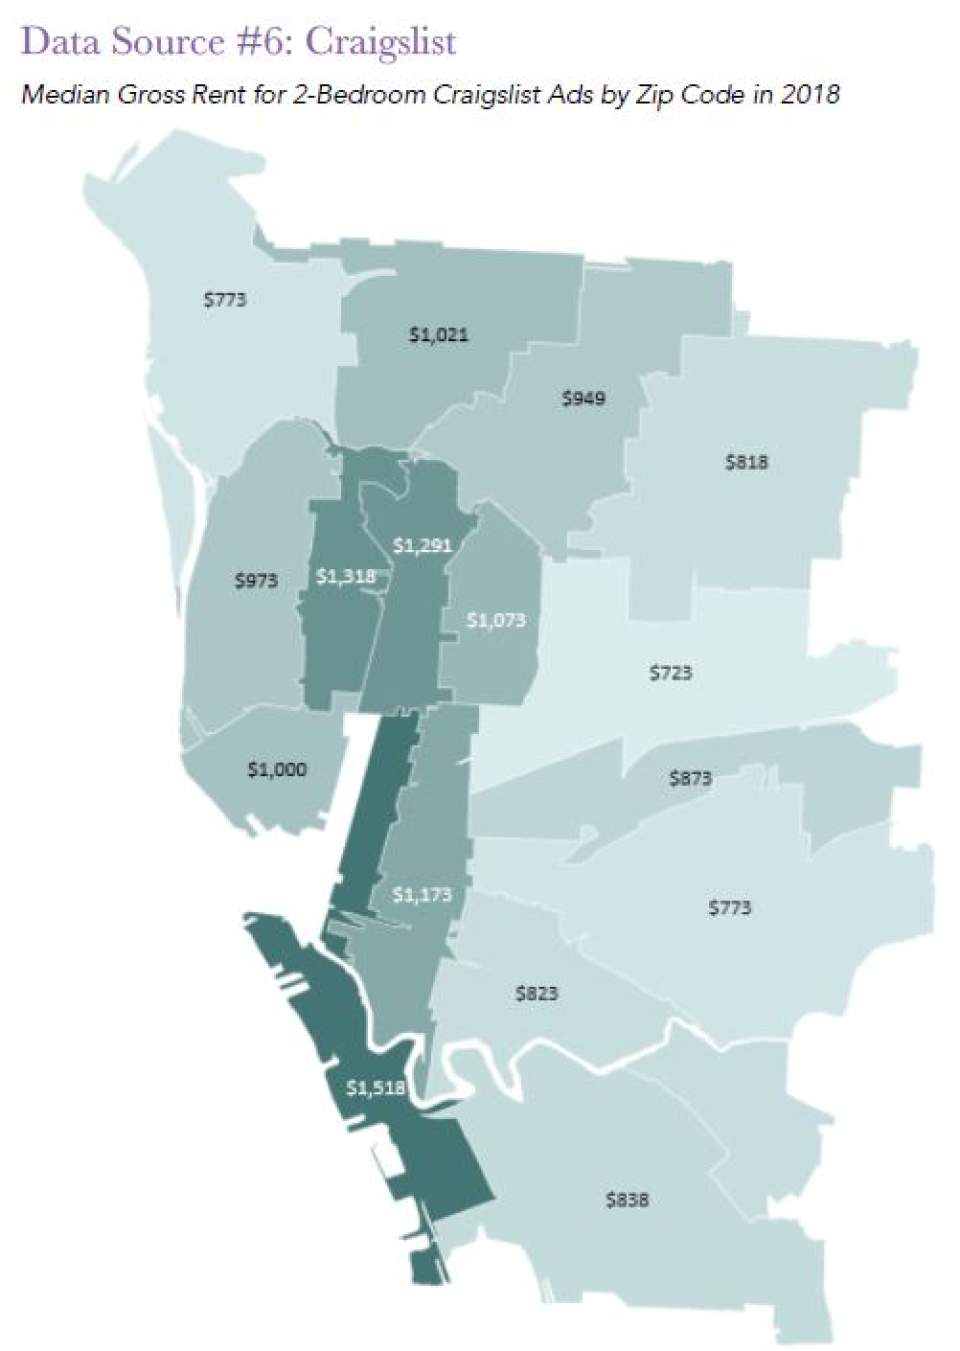
Our new fact sheet summarizes the data currently available on the changing costs of rental housing in Buffalo, NY. It explores six data sources for rent figures and what each one can tell us about Buffalo’s rental market. The sources include U.S. Census data, online rental listing sites, and housing organizations in Buffalo.
At the city level, we see that rents have increased – mildly in some neighborhoods and more steeply in others. The city’s housing market has tightened and rents are up, particularly in the affluent corridor that stretches from the waterfront to North Buffalo, centered roughly on Elmwood and Delaware Avenues. Recently, this trend has begun to extend to other neighborhoods, especially on the West Side but also including the Fruit Belt, Hamlin Park, and beyond. Reports from housing placement agencies show that these trends are starting to have negative impacts on people with lower incomes seeking housing.
The fact sheet was drafted by Sarah Wooton, Policy Analyst at Partnership for the Public Good. It was prepared for the Open Buffalo Innovation Lab.